
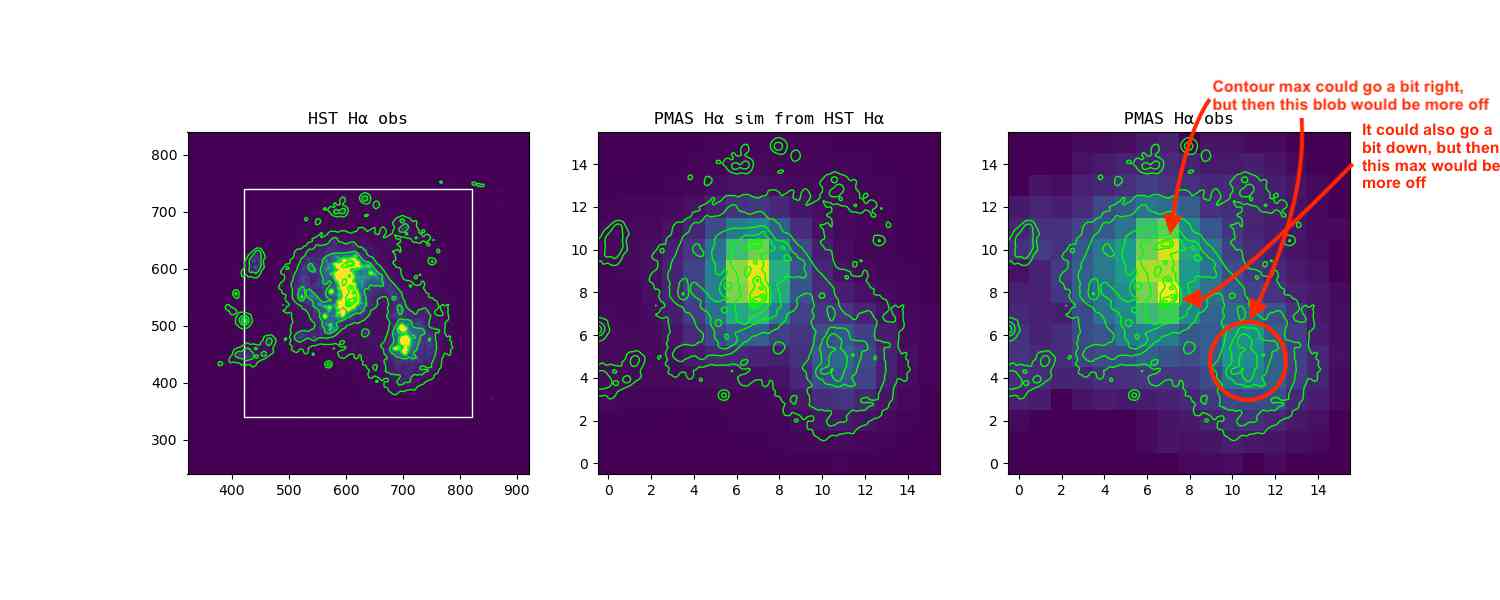
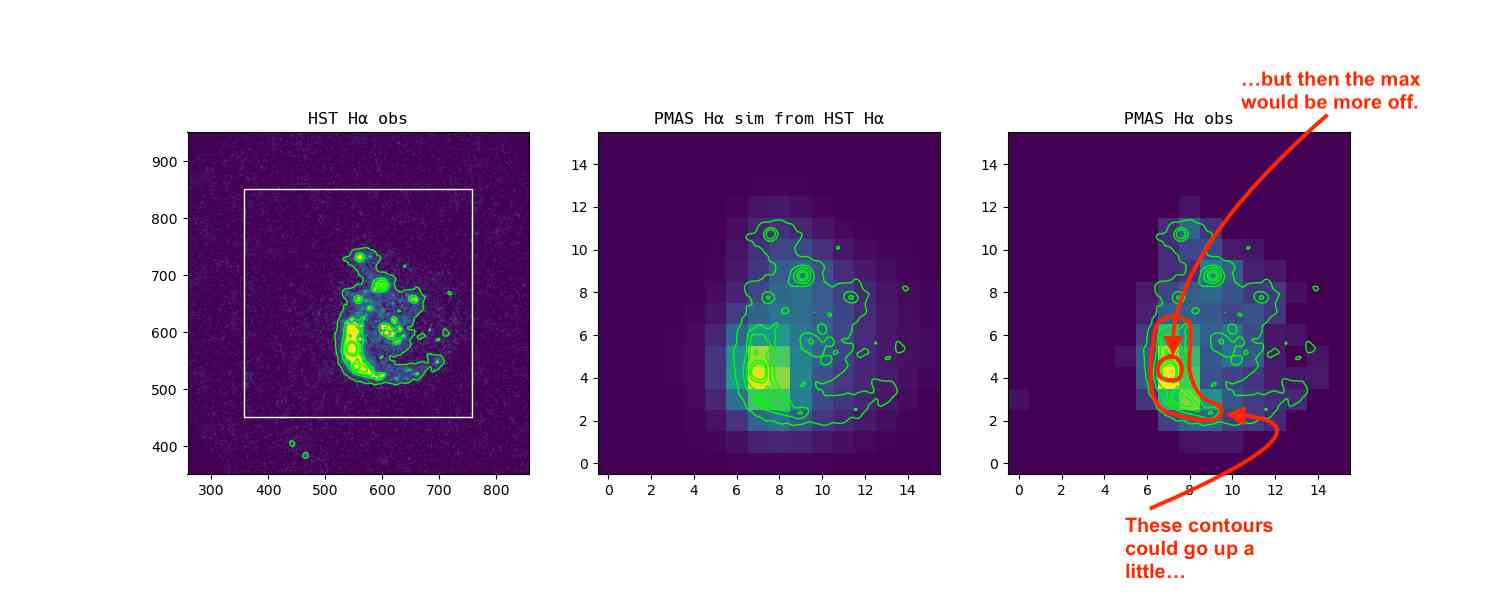
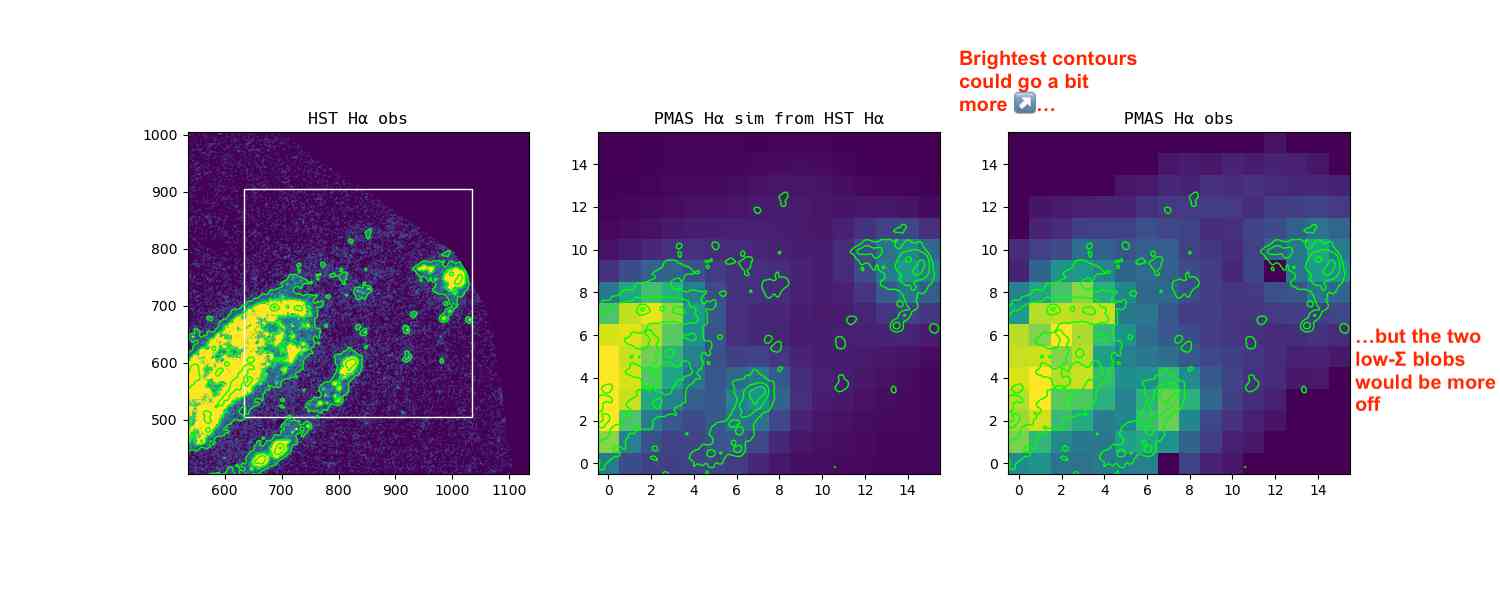
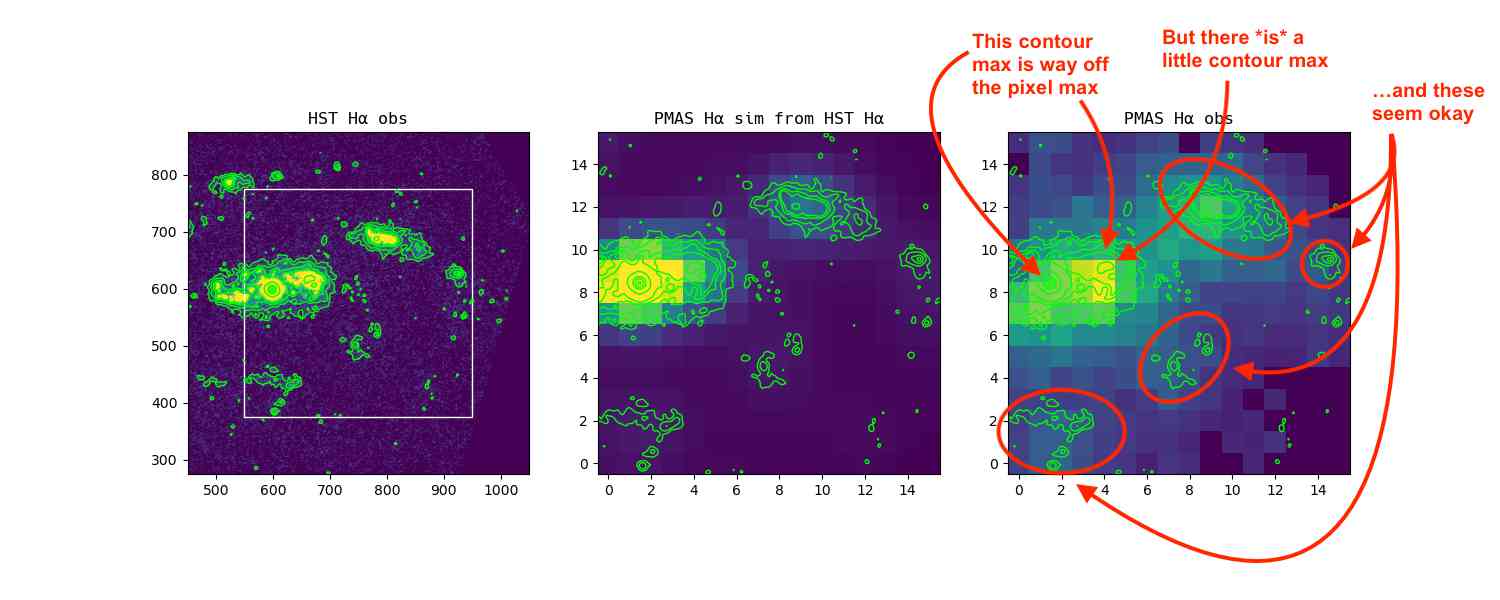
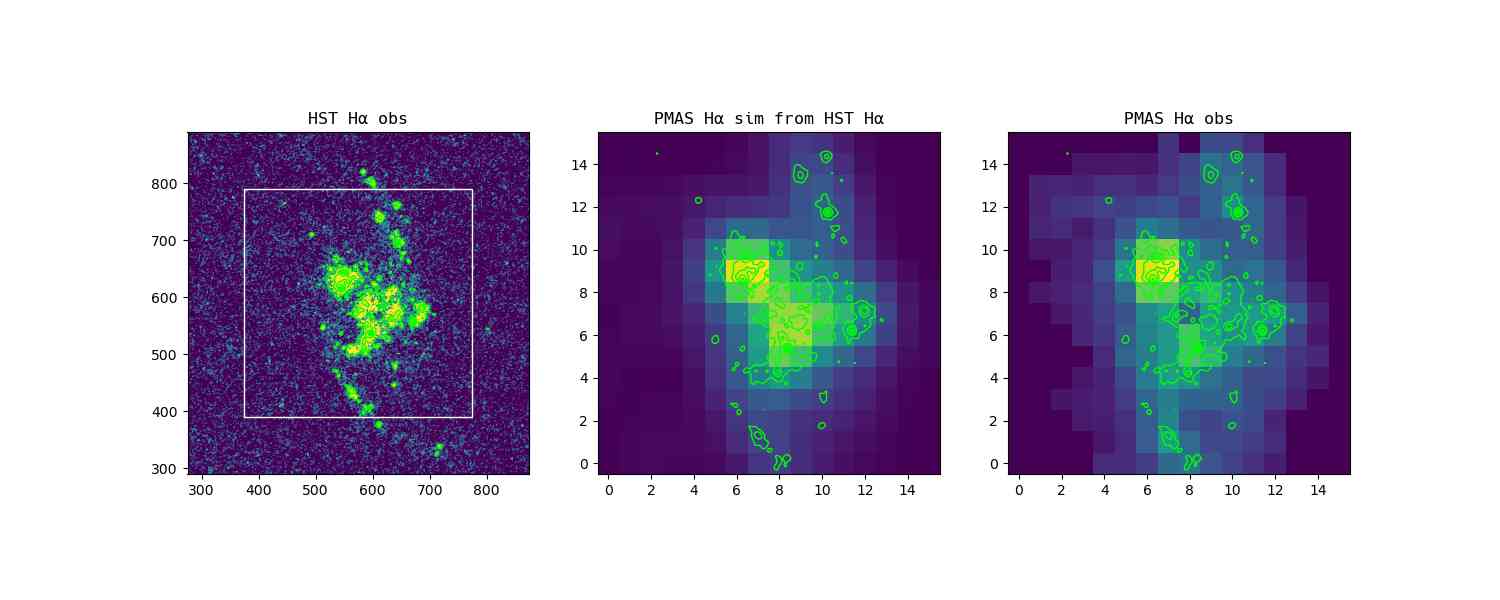
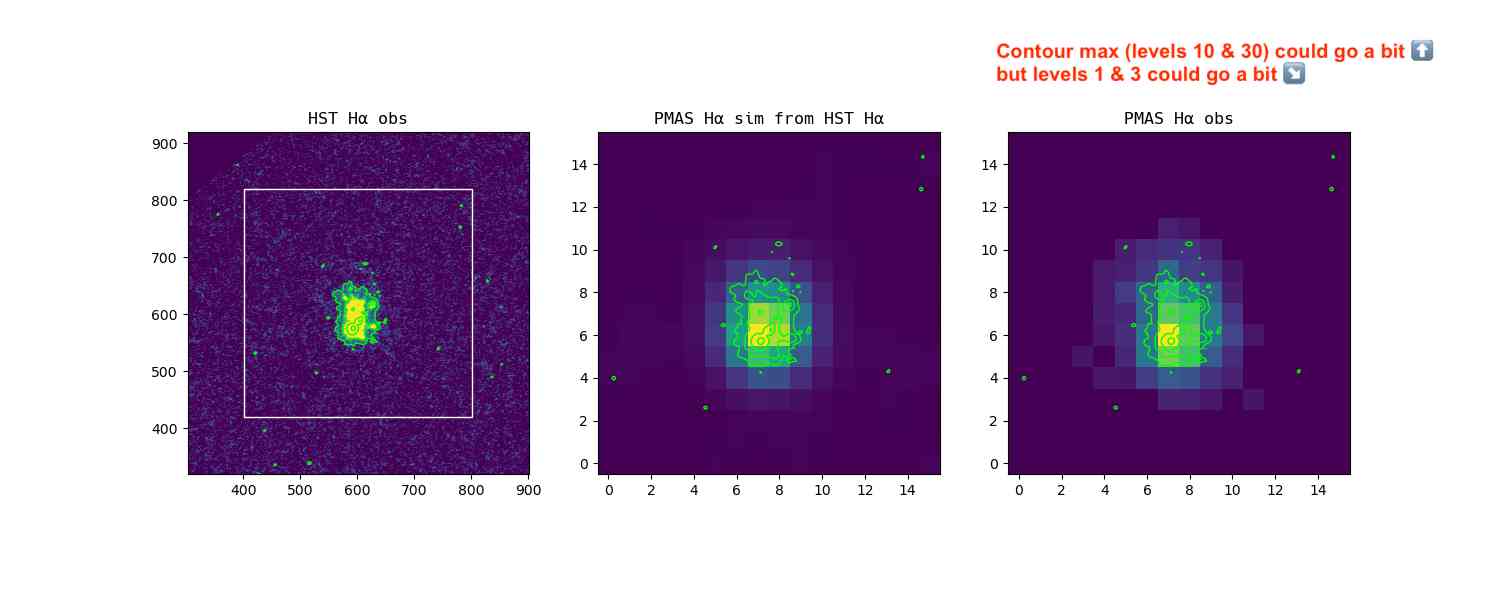
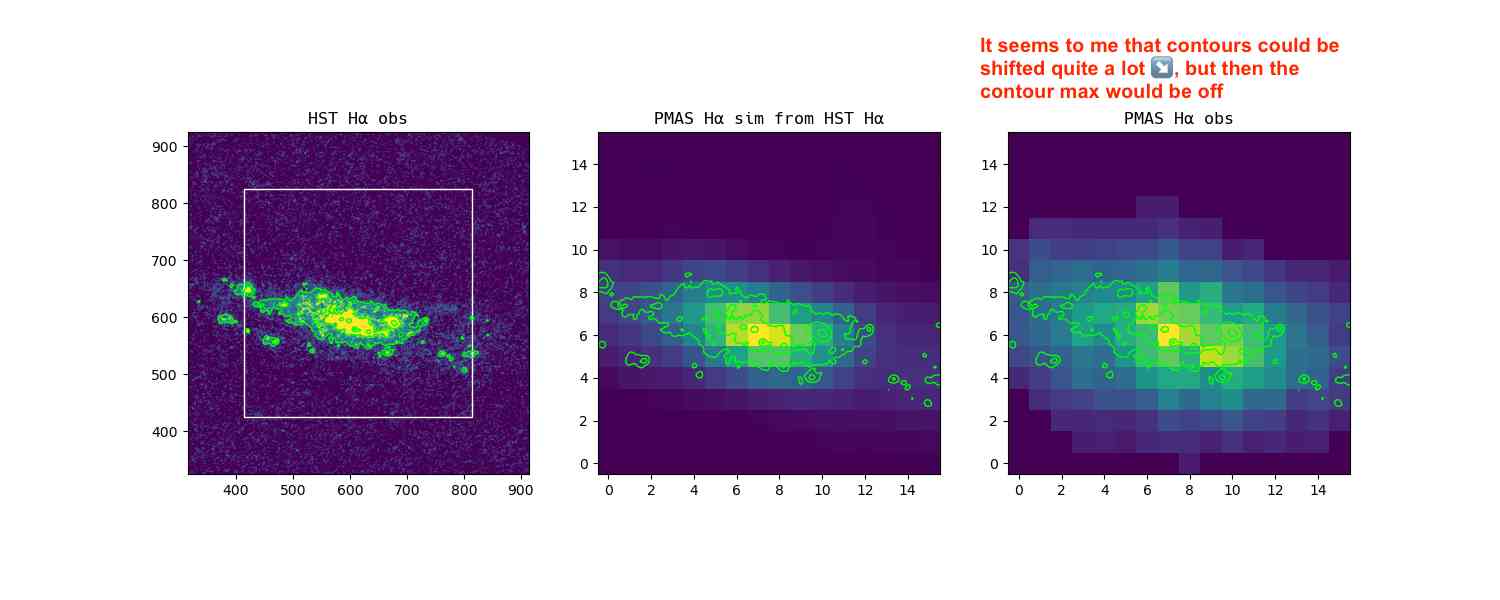
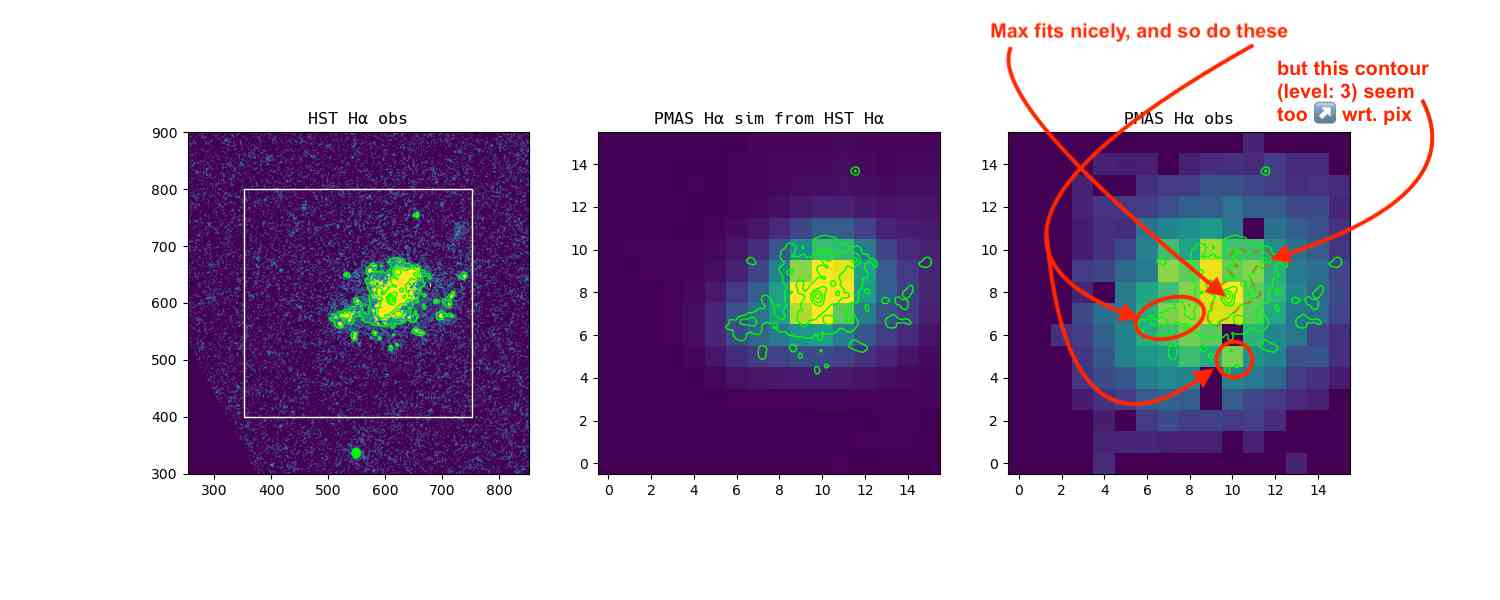
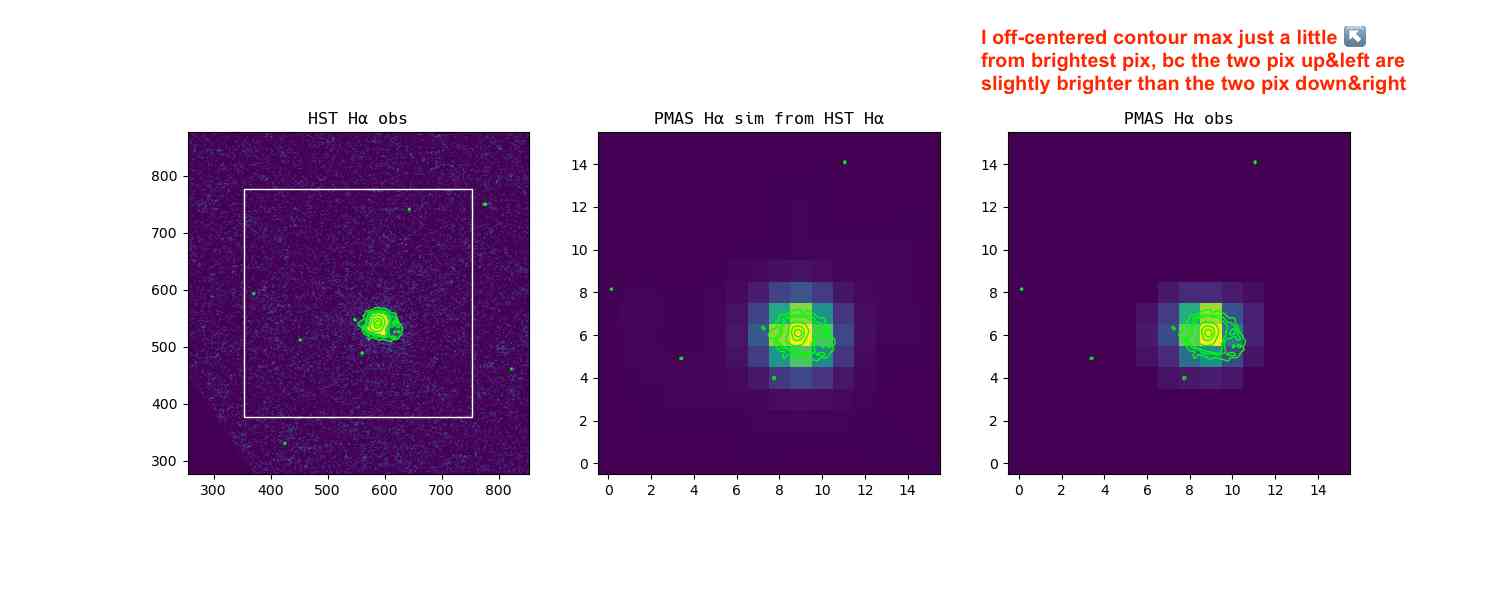
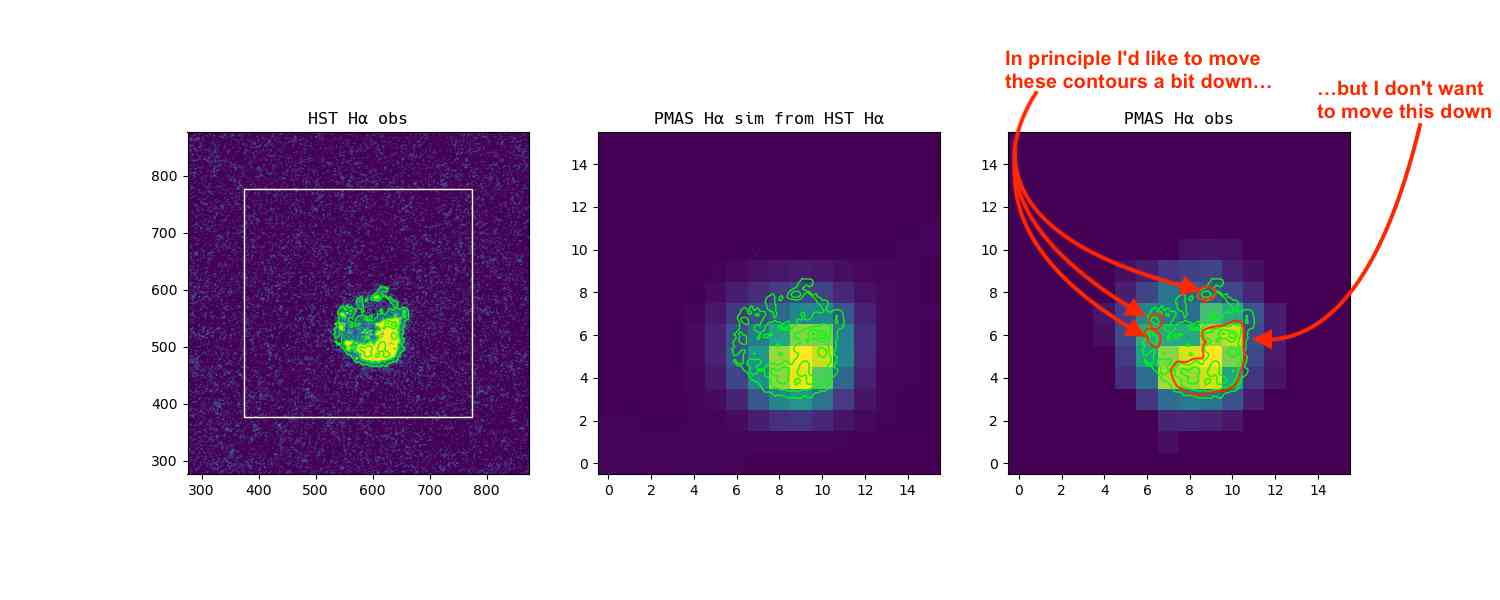
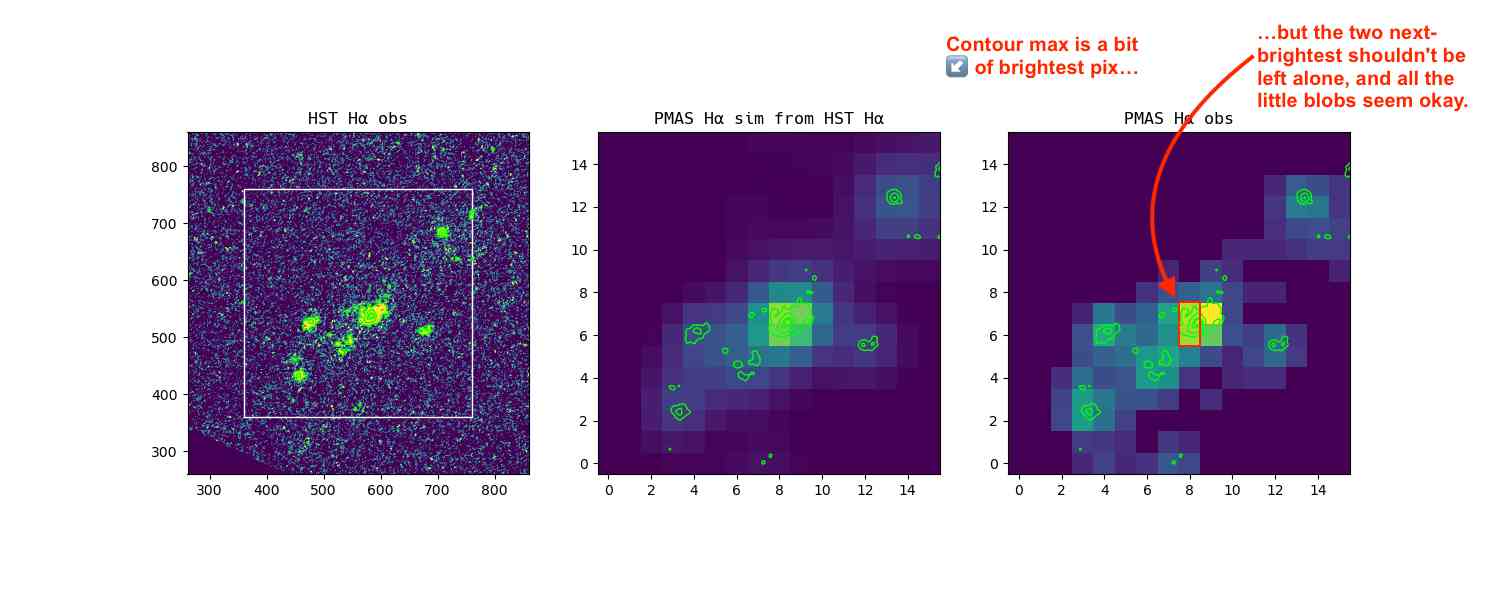
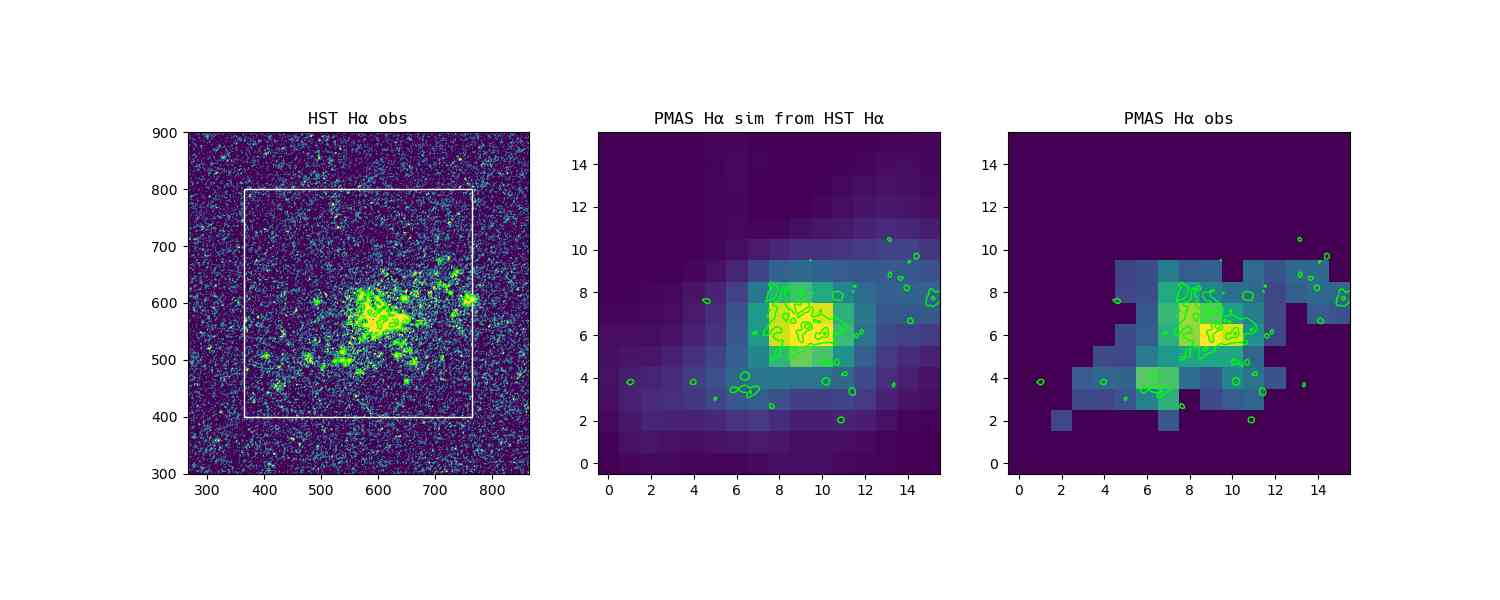
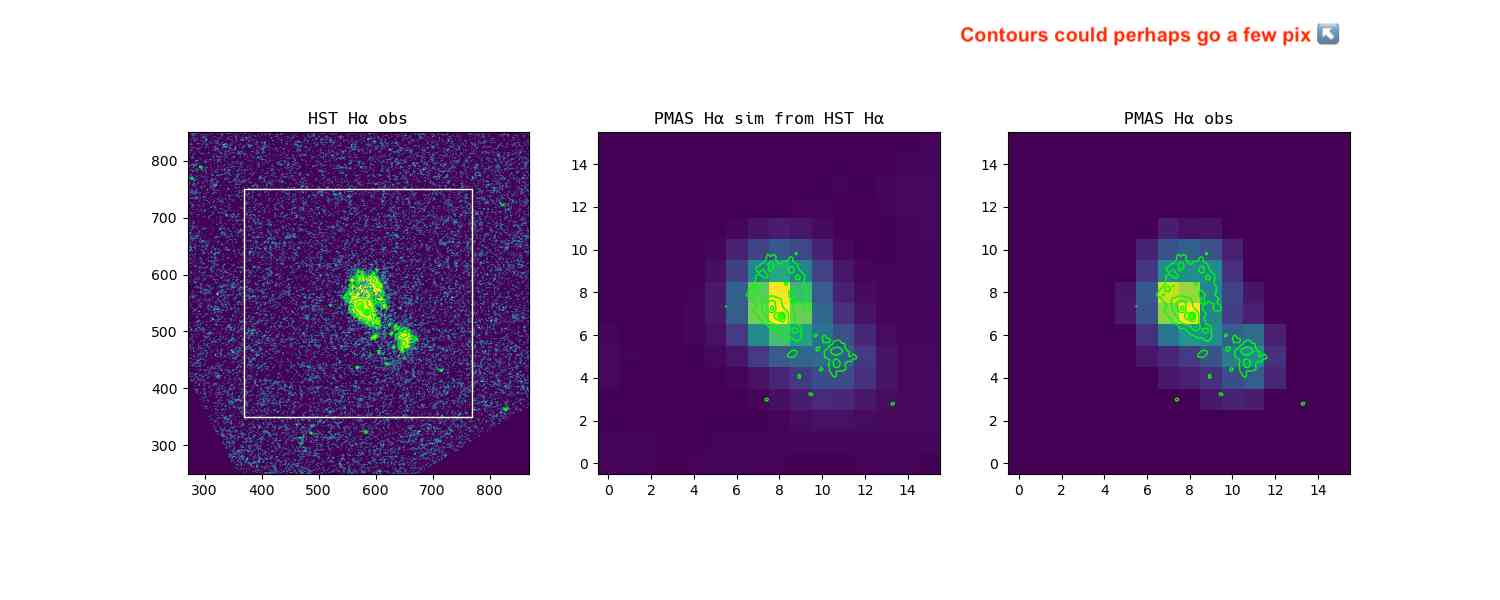
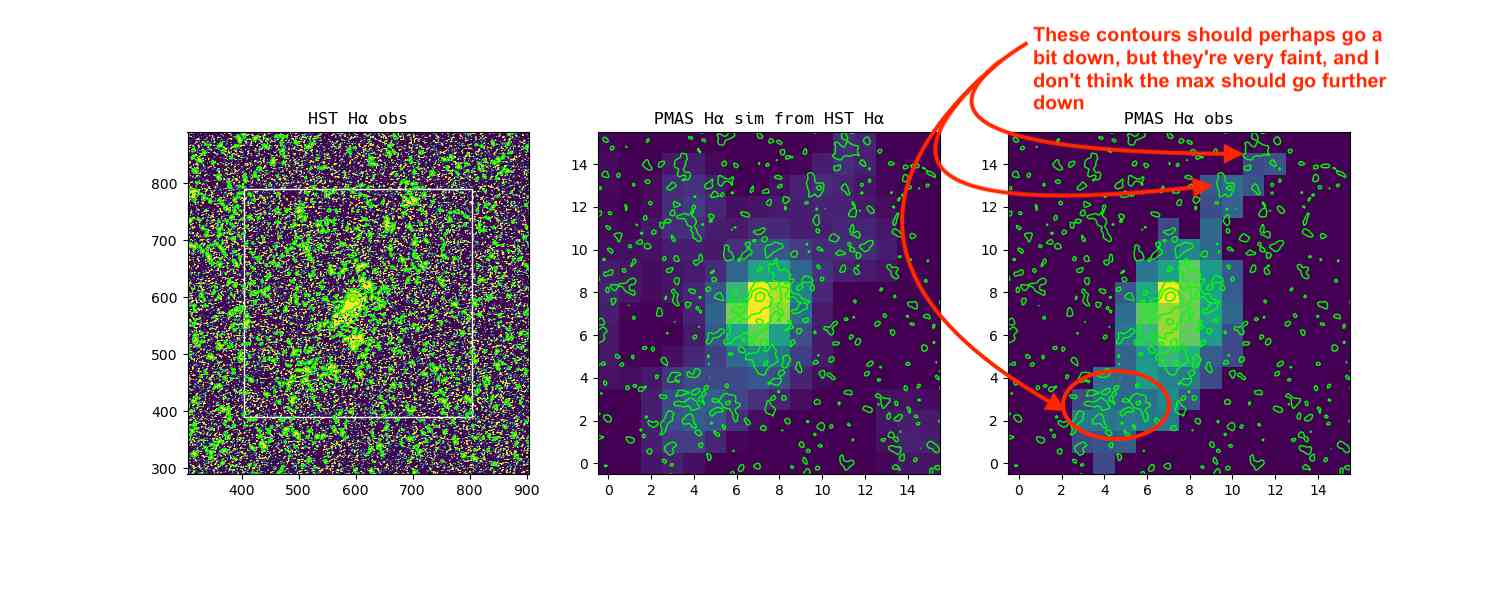
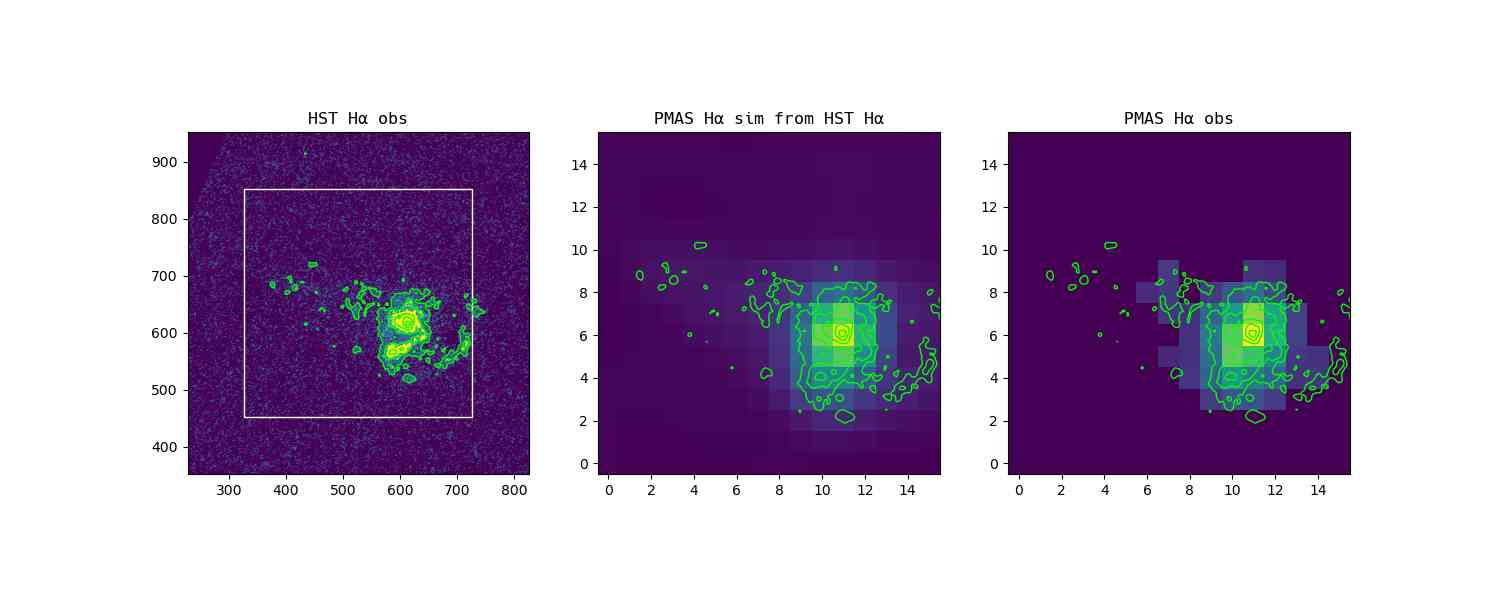
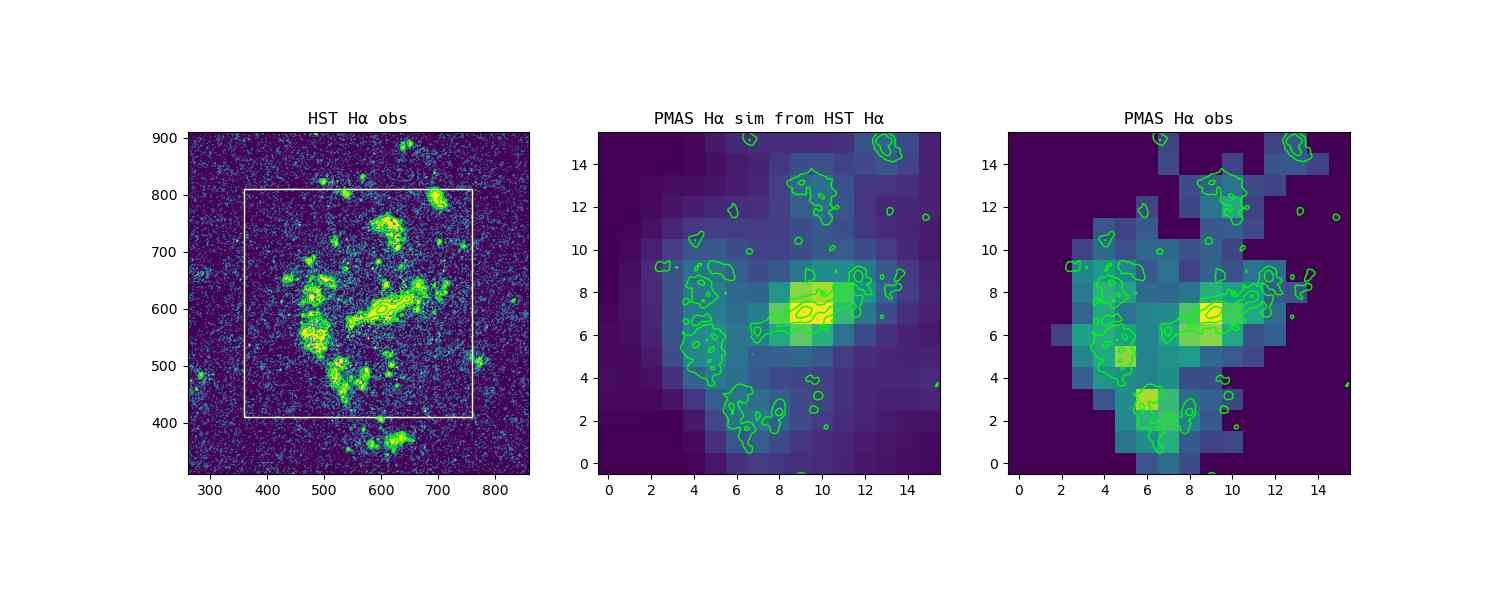
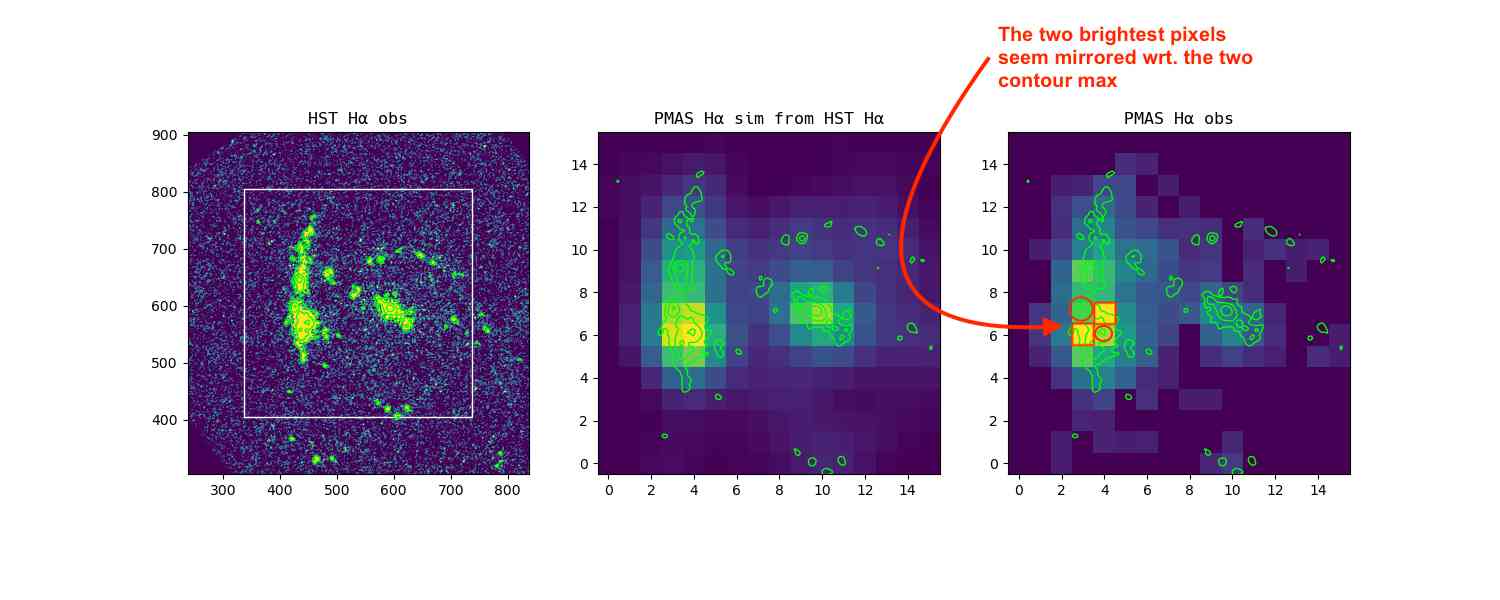
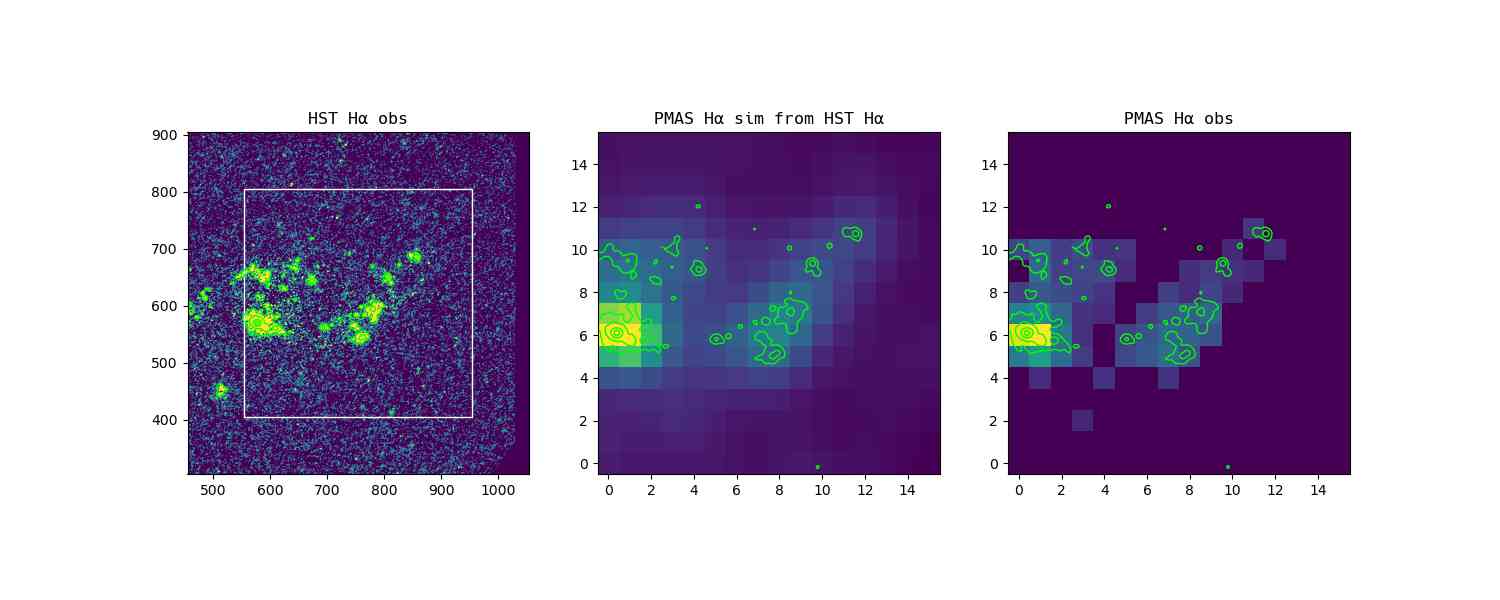
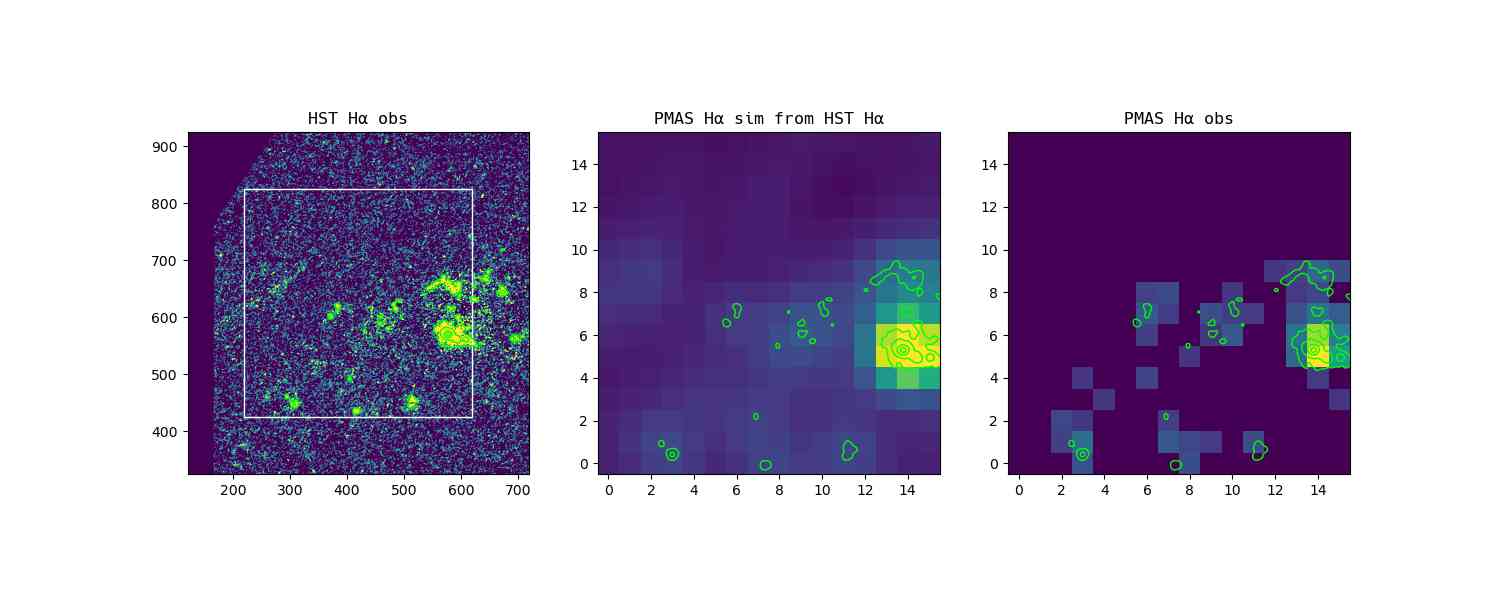
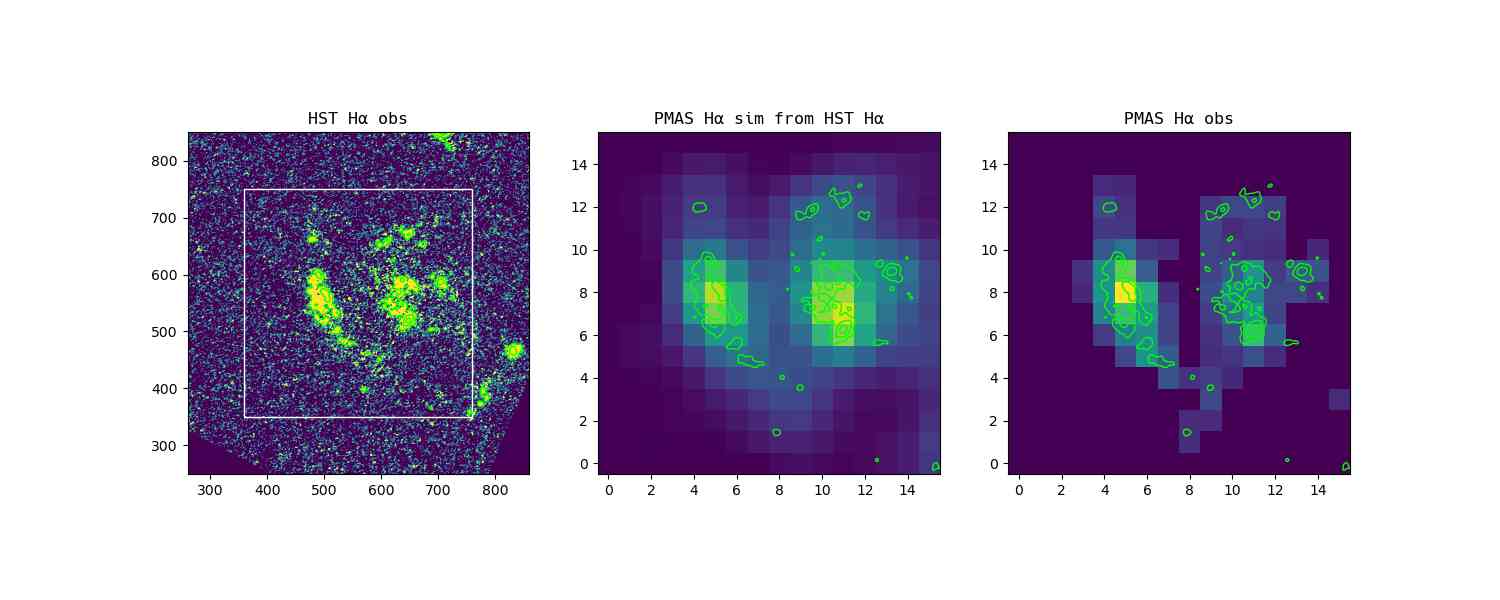
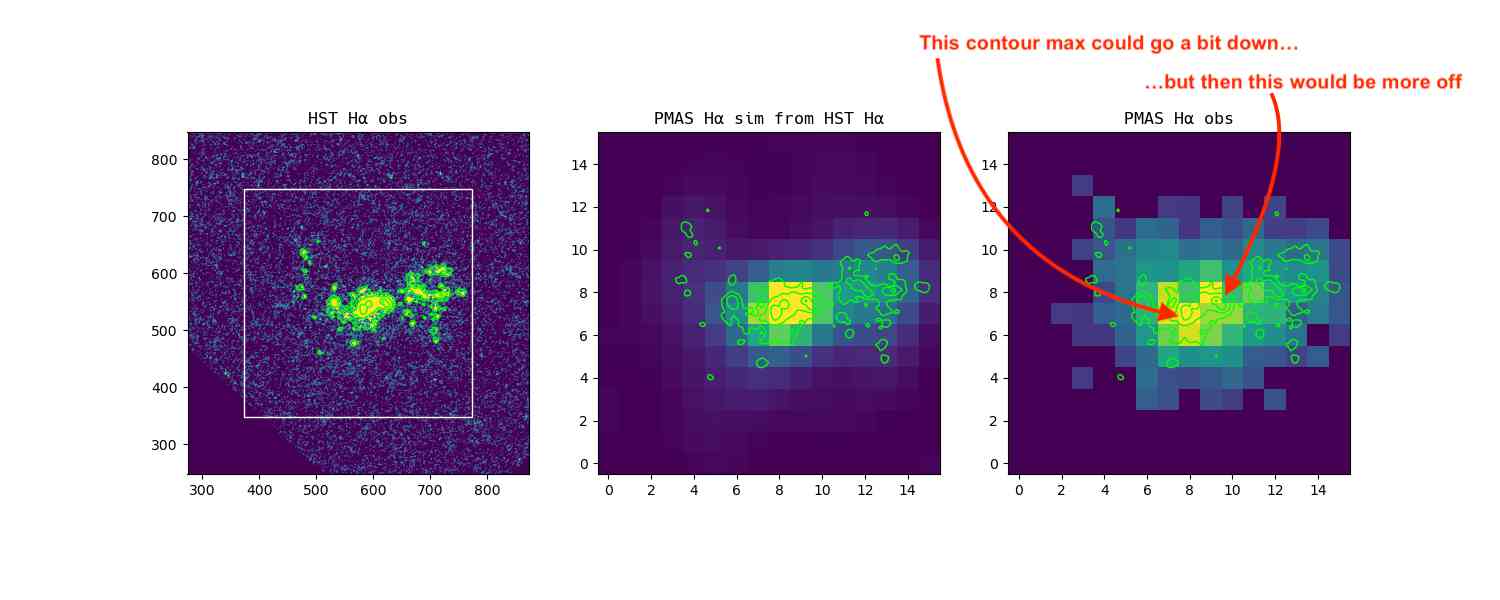
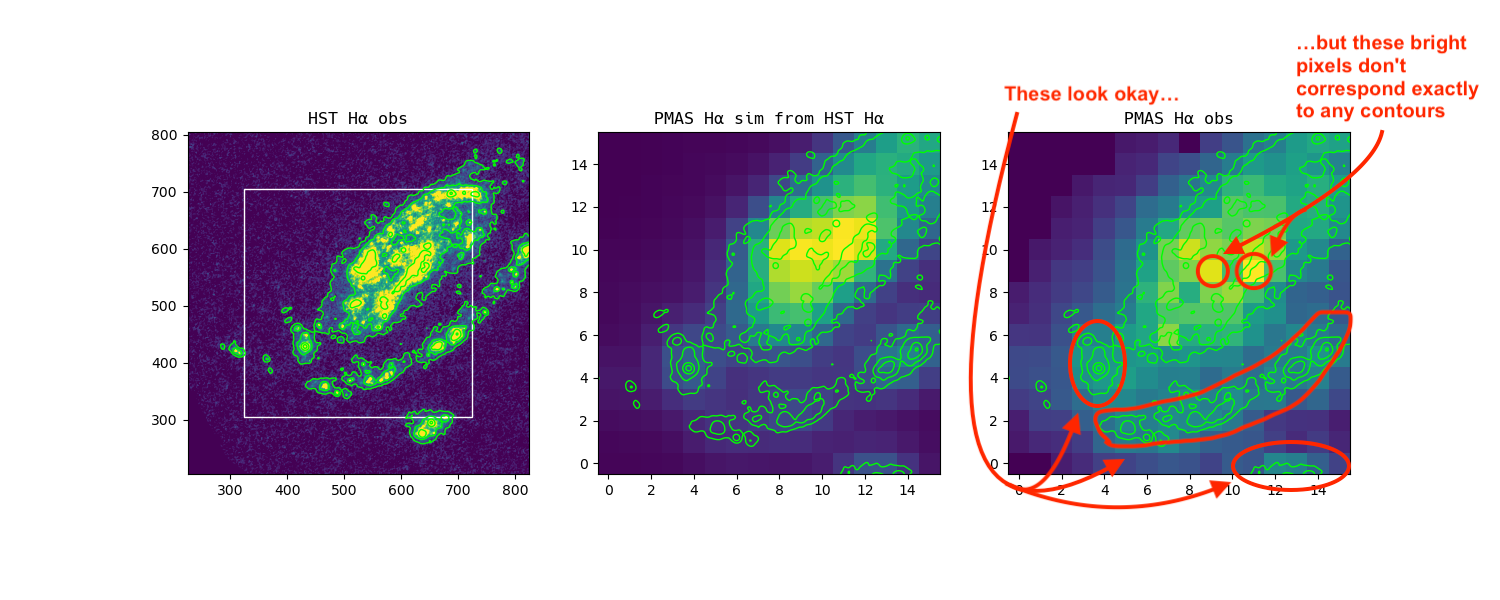
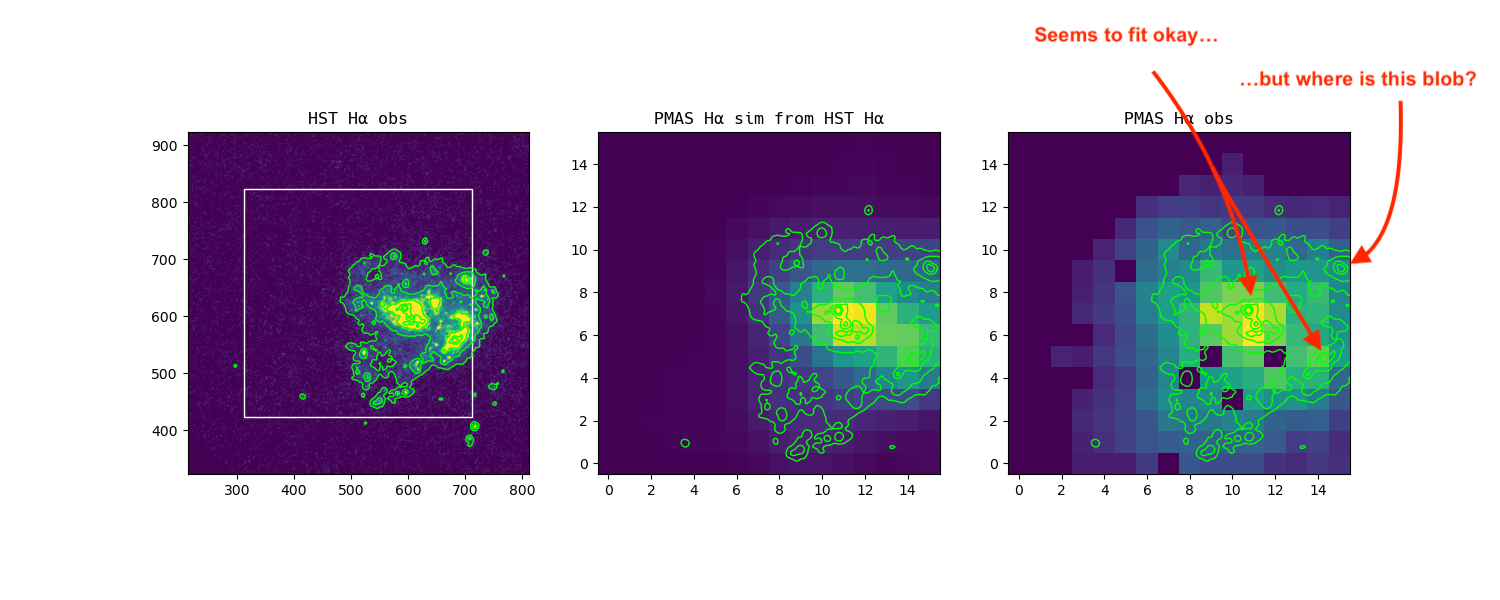
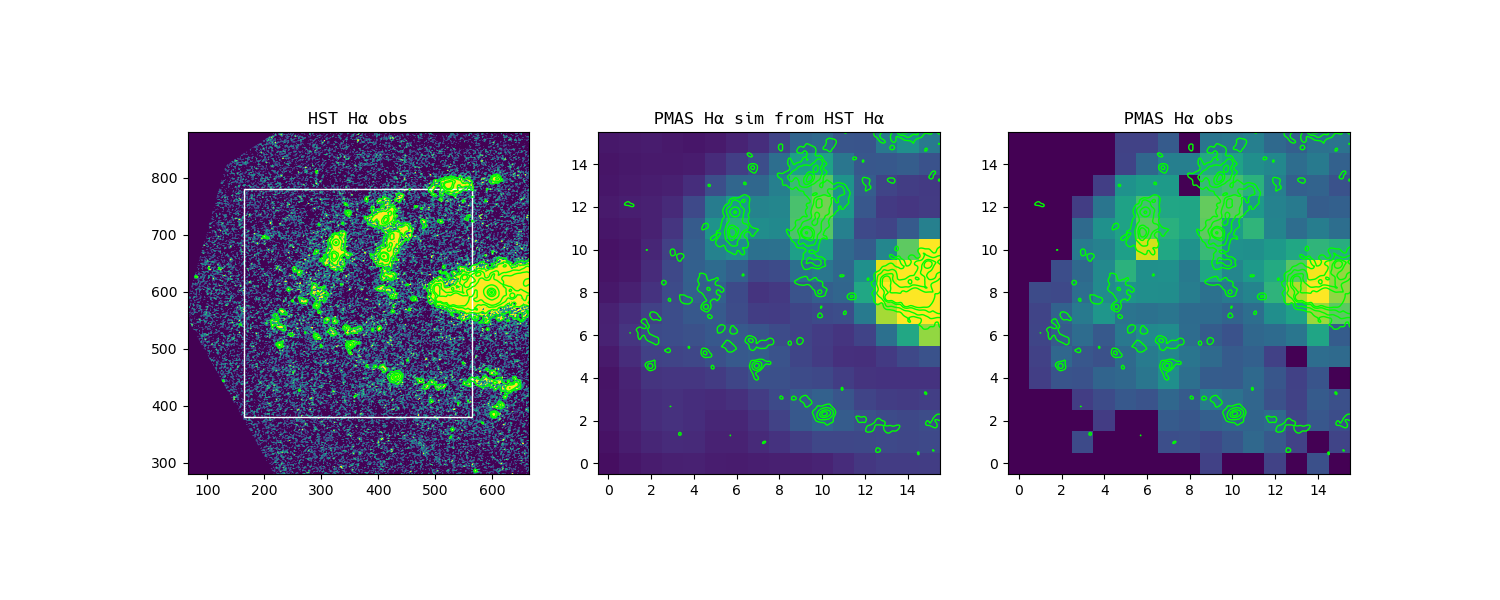
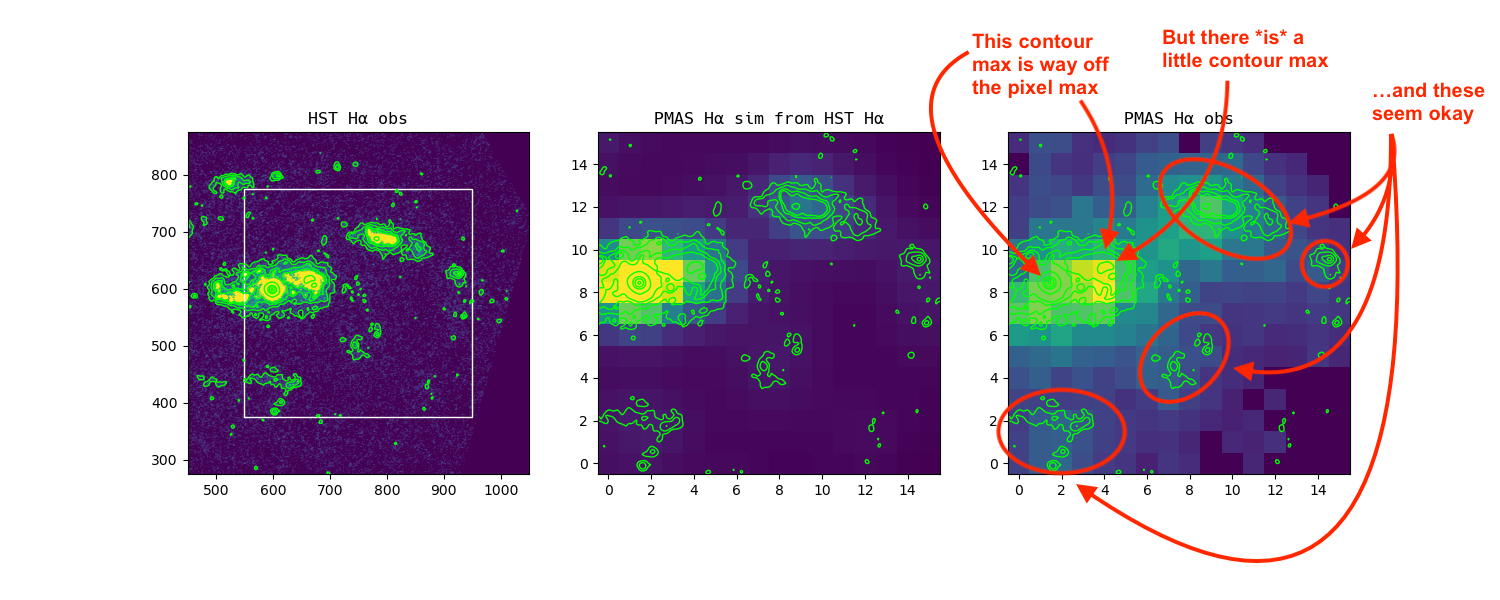
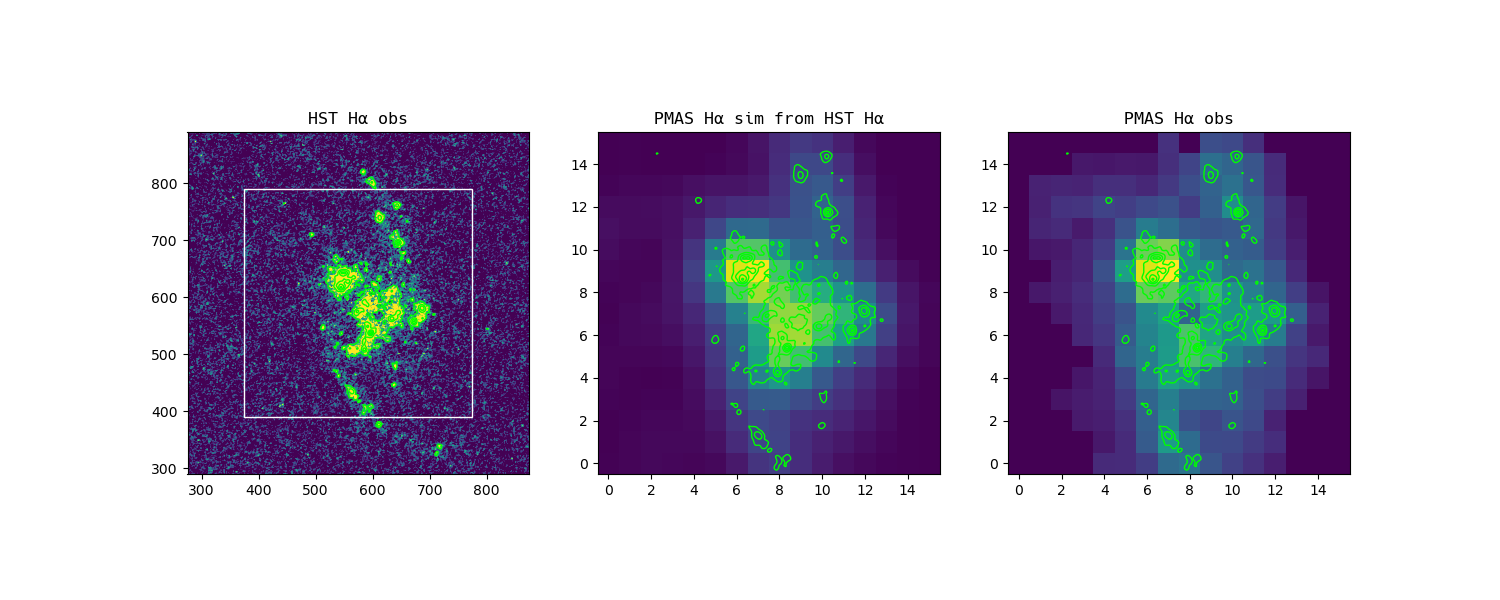
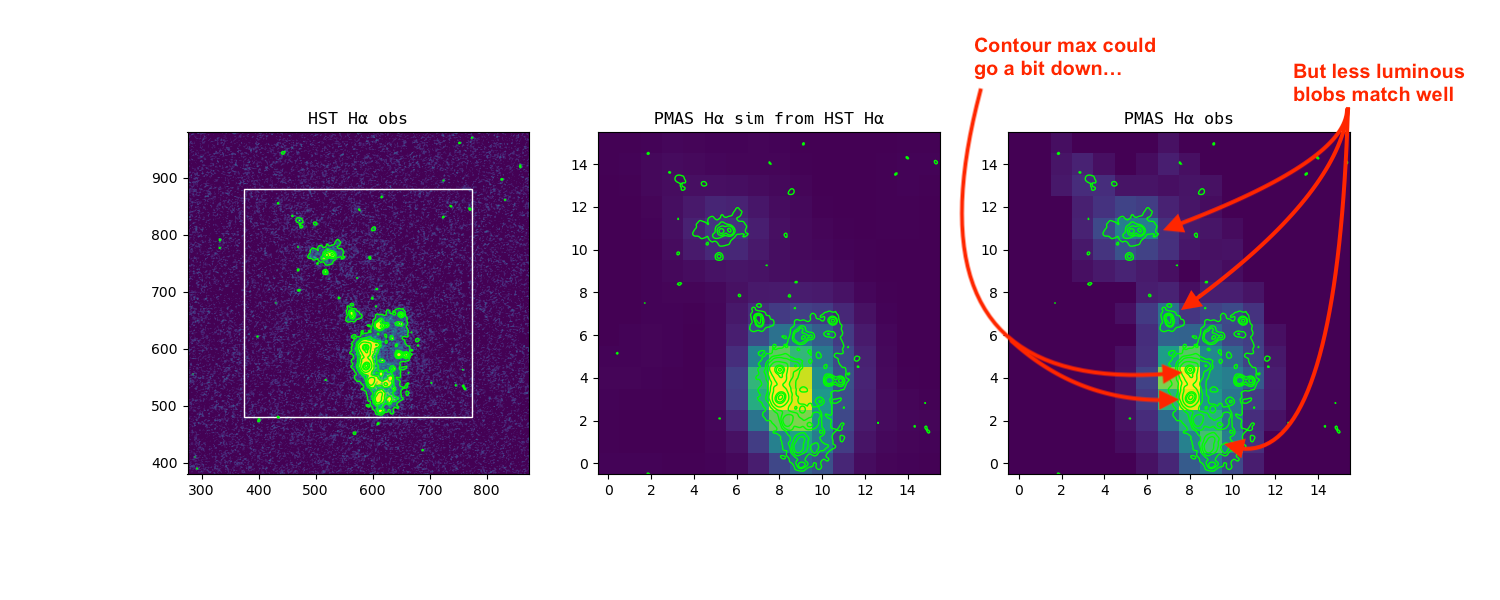
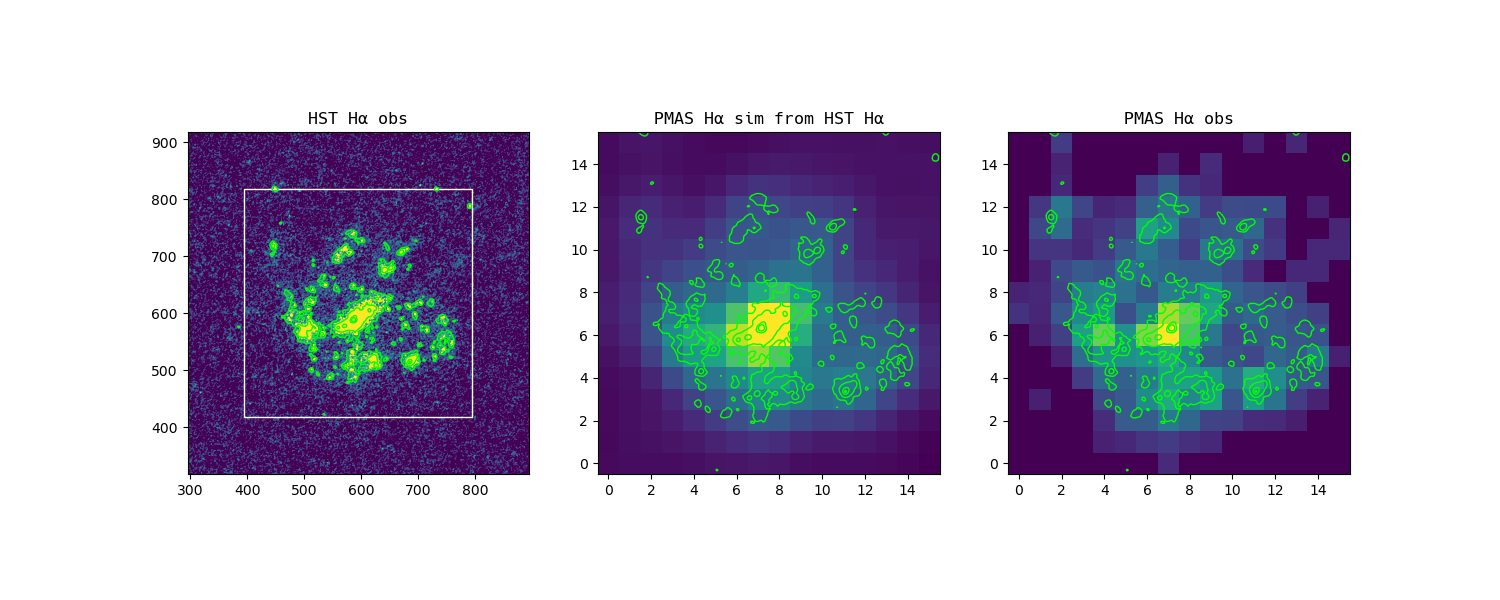
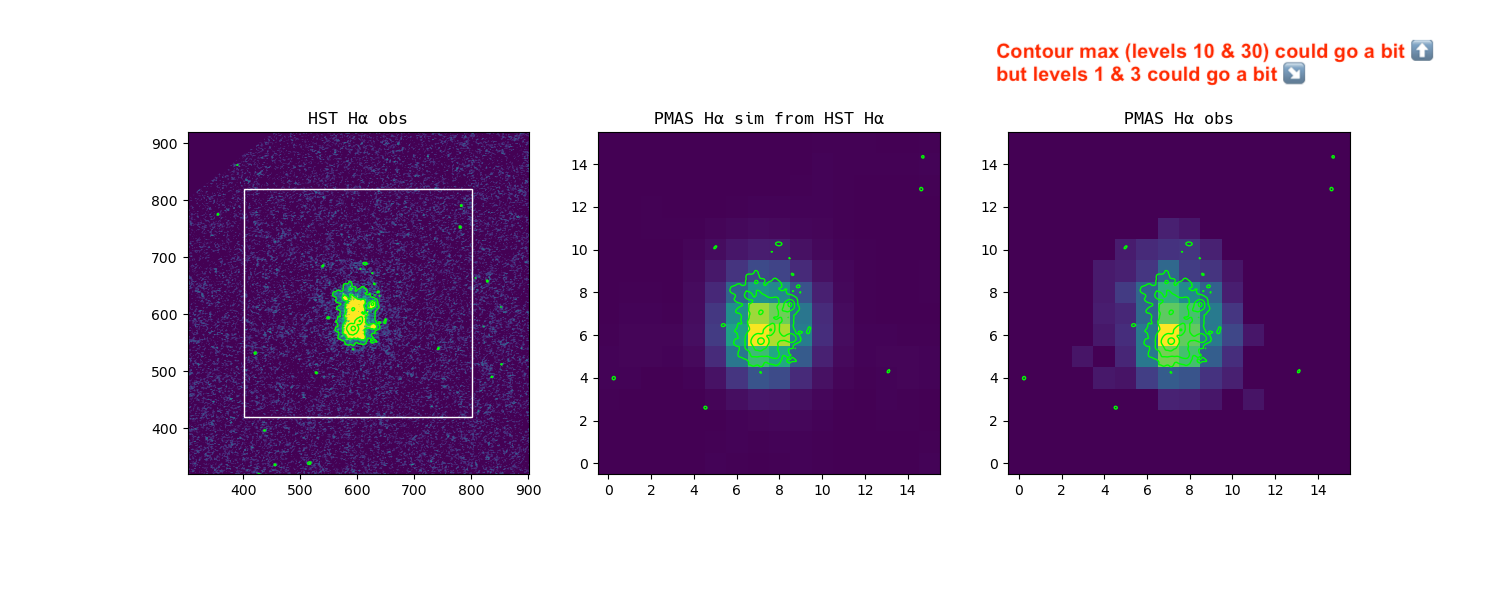
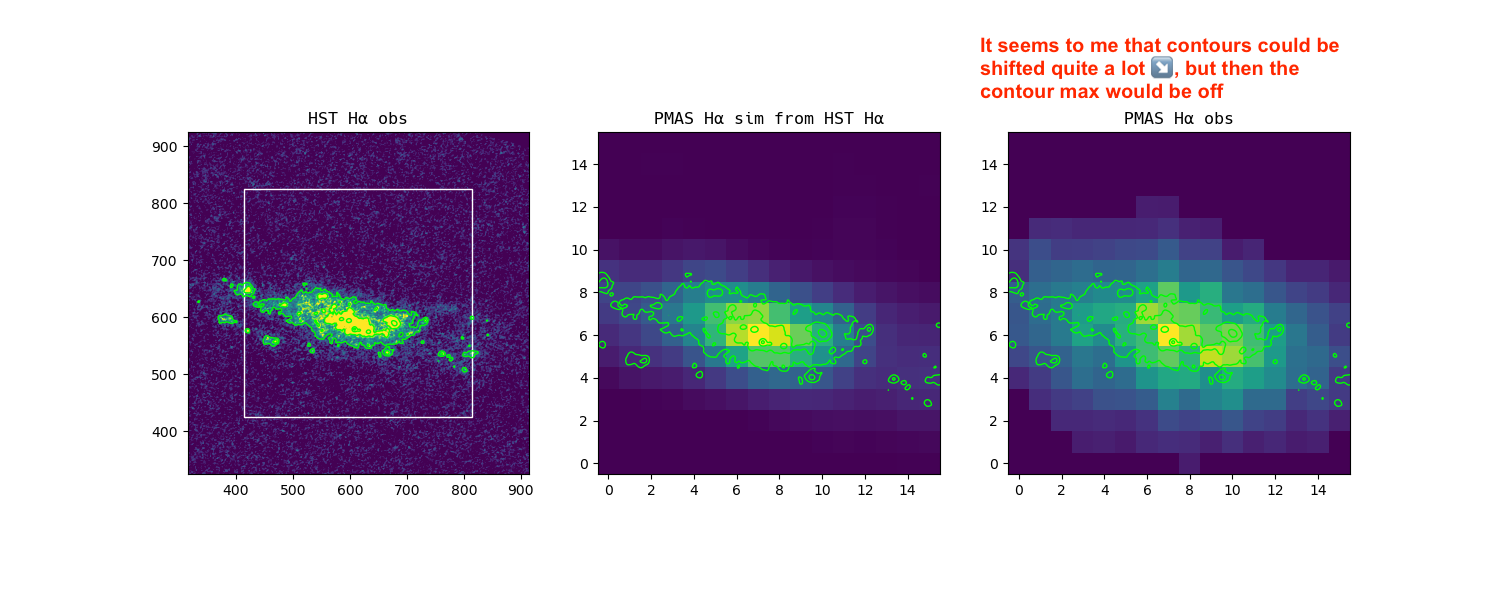
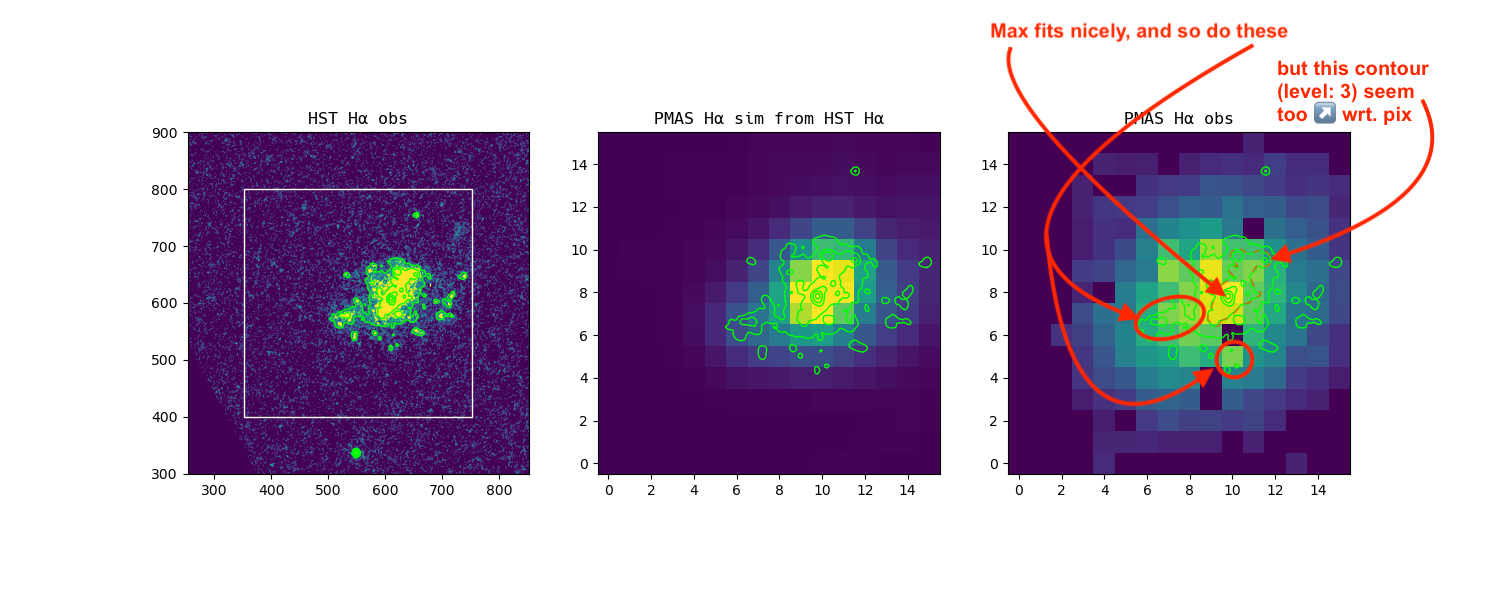
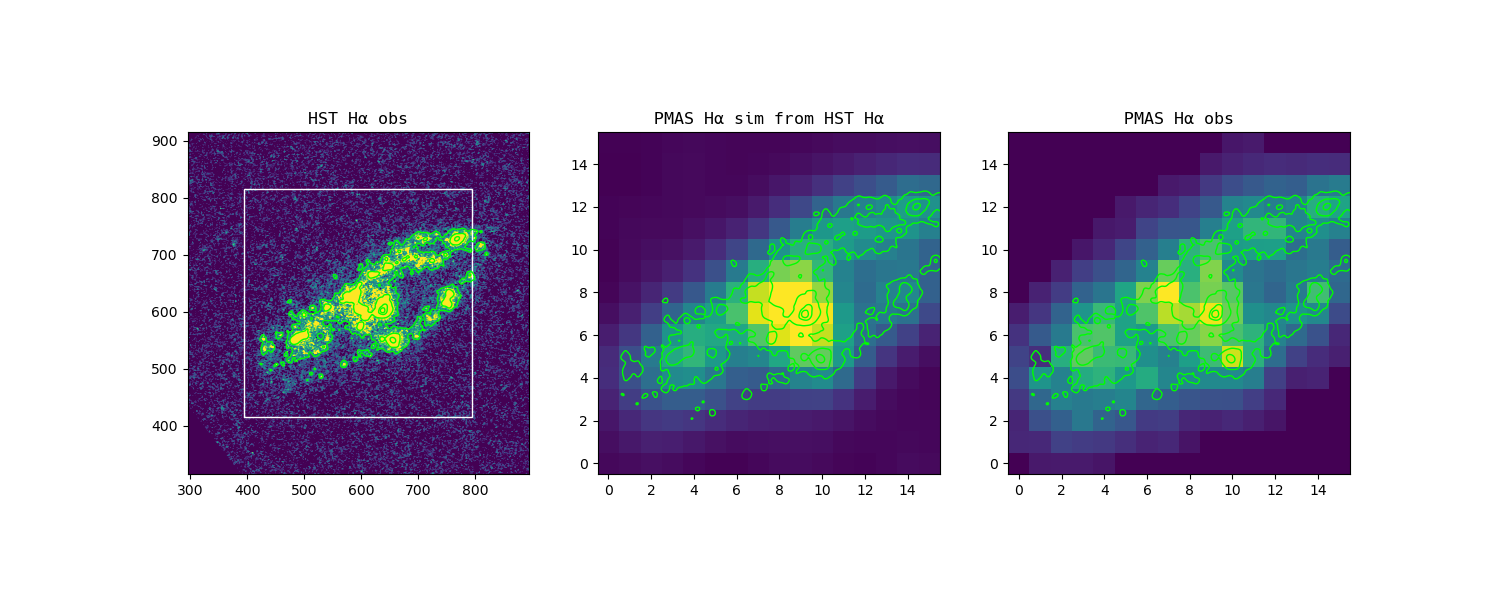
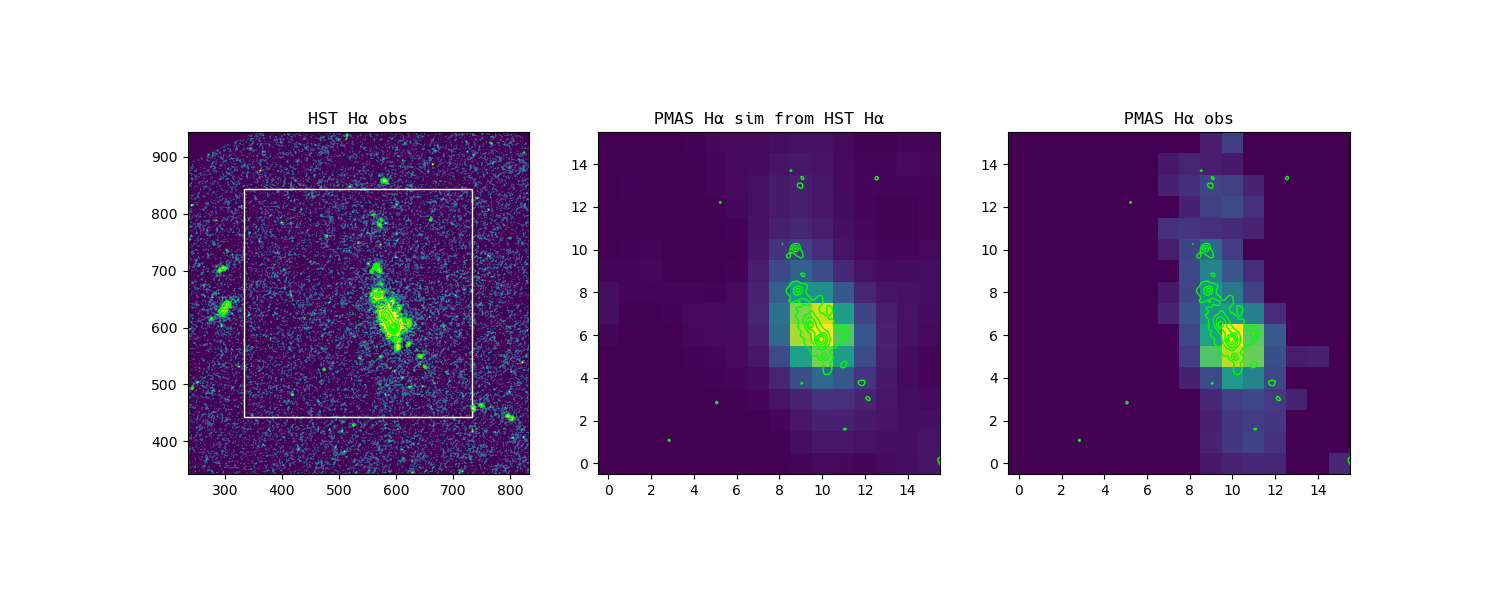
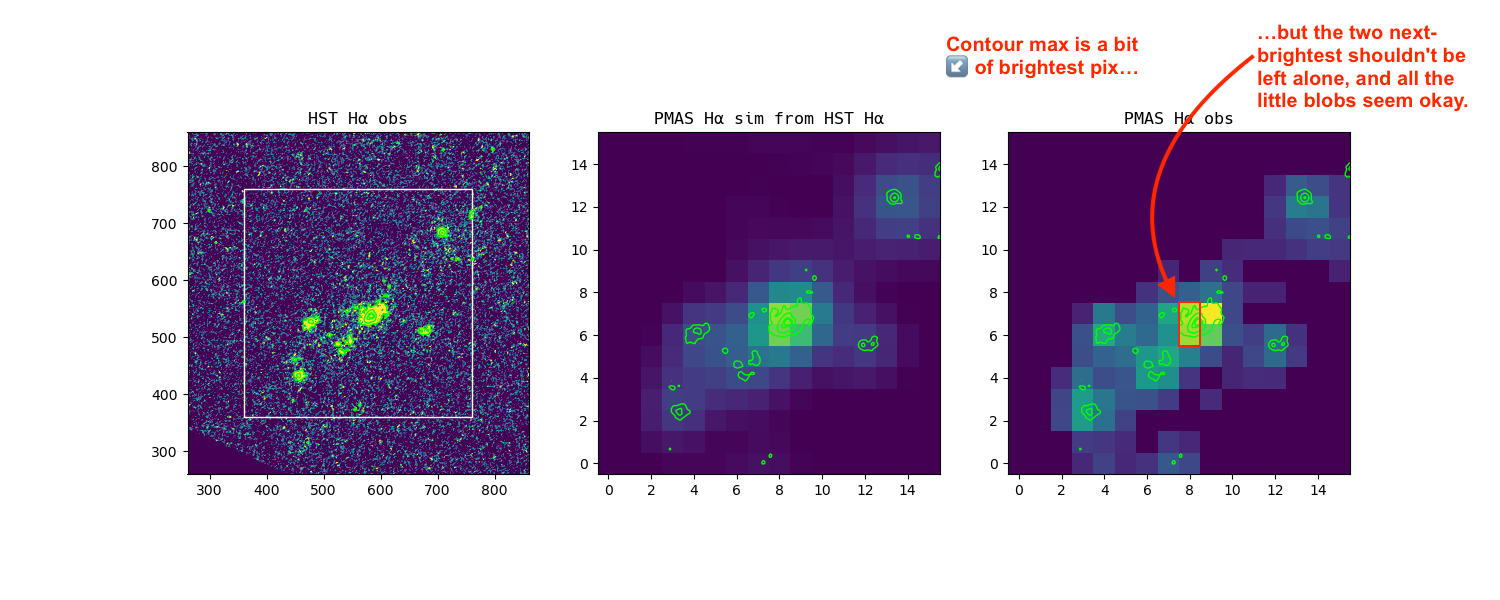
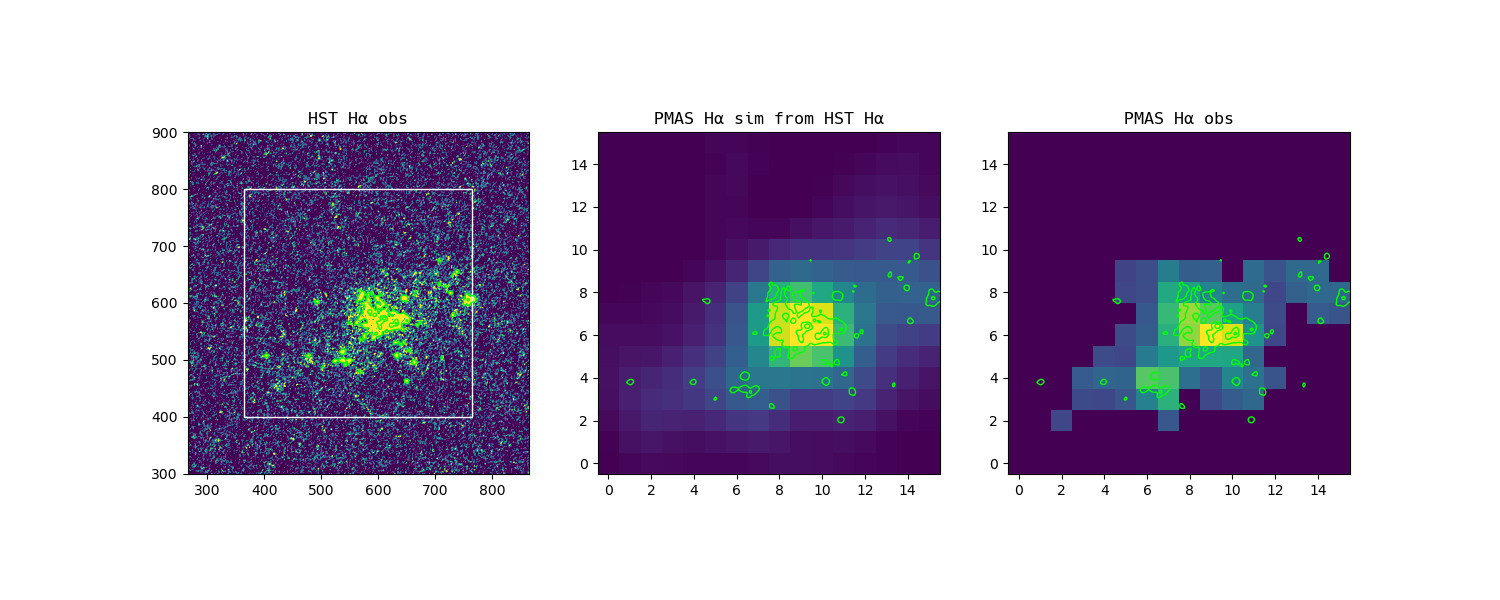
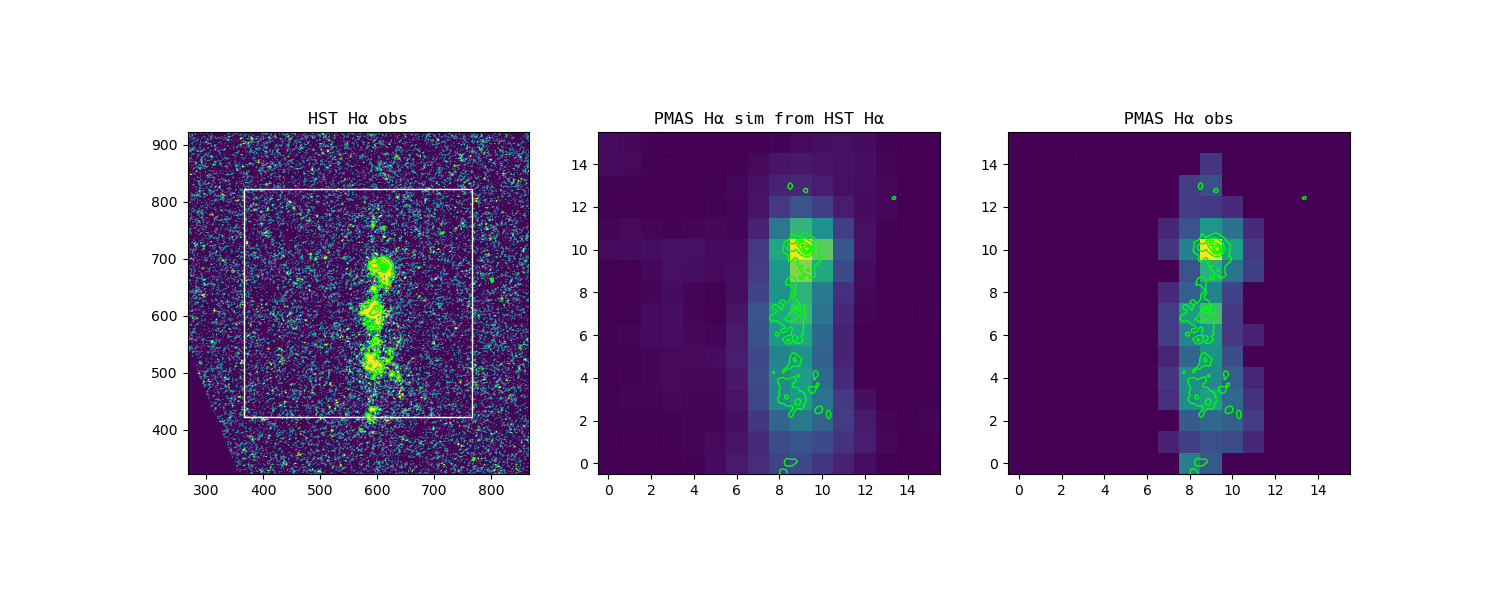
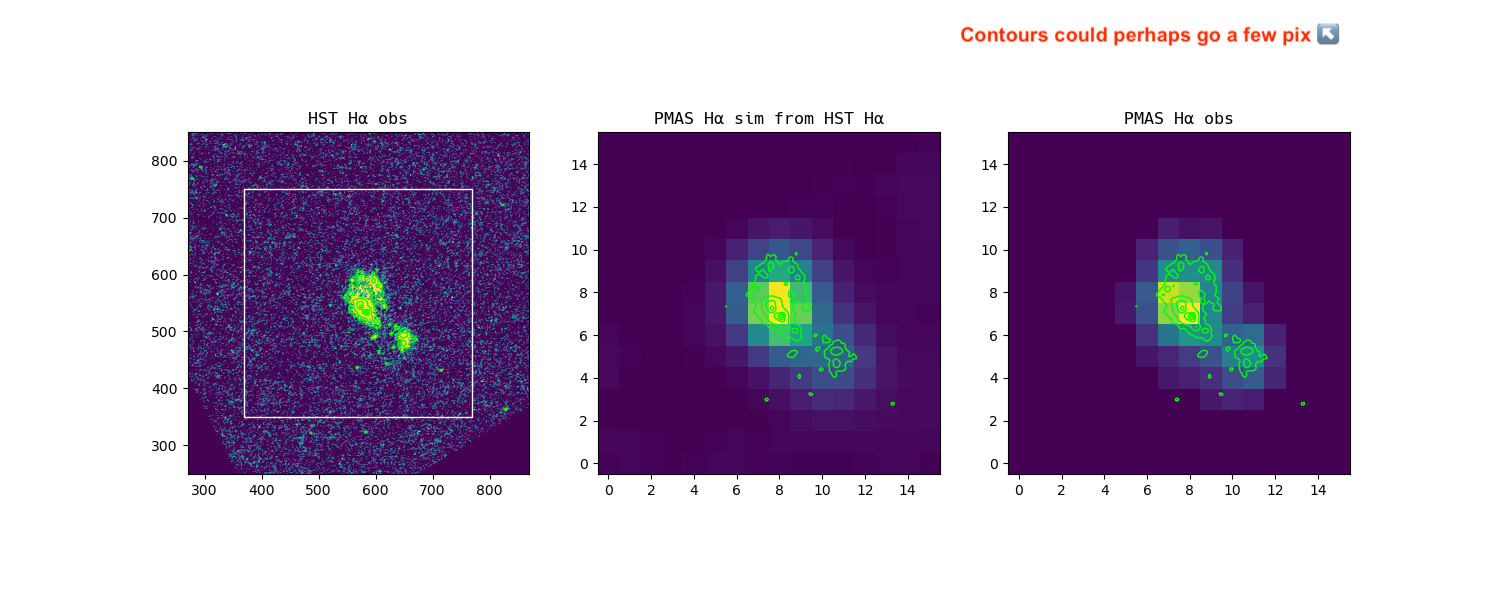
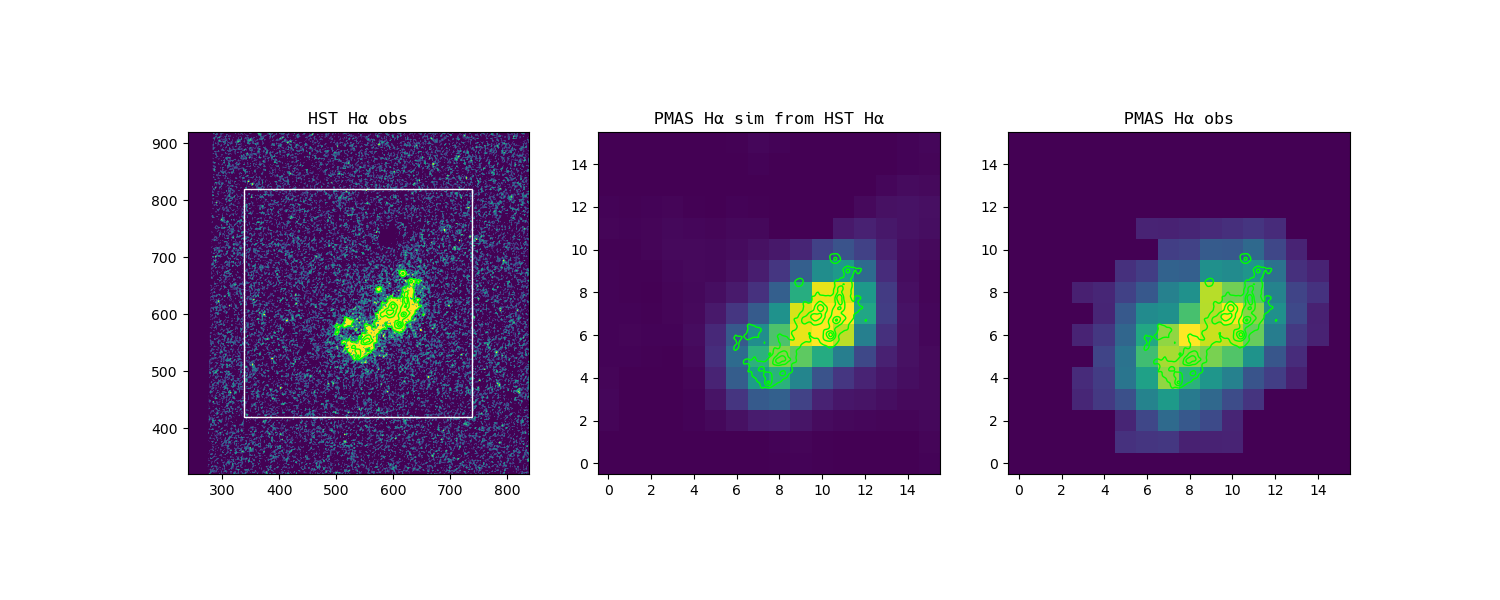
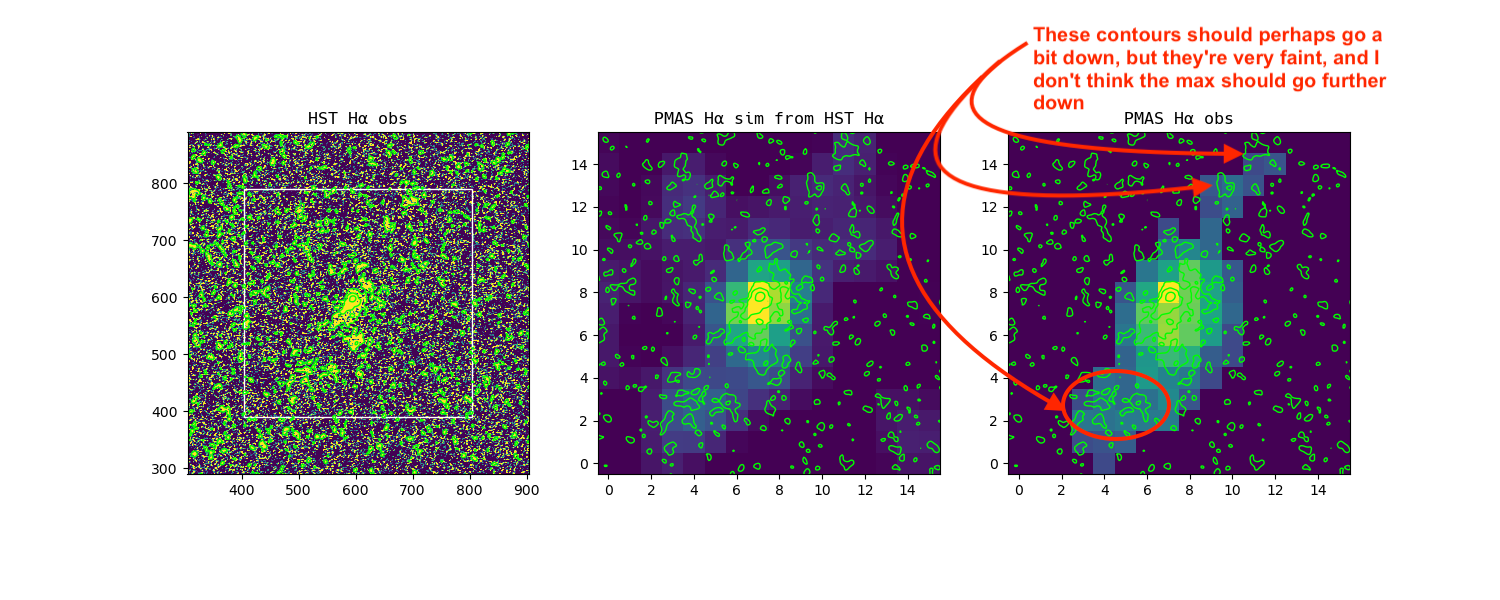
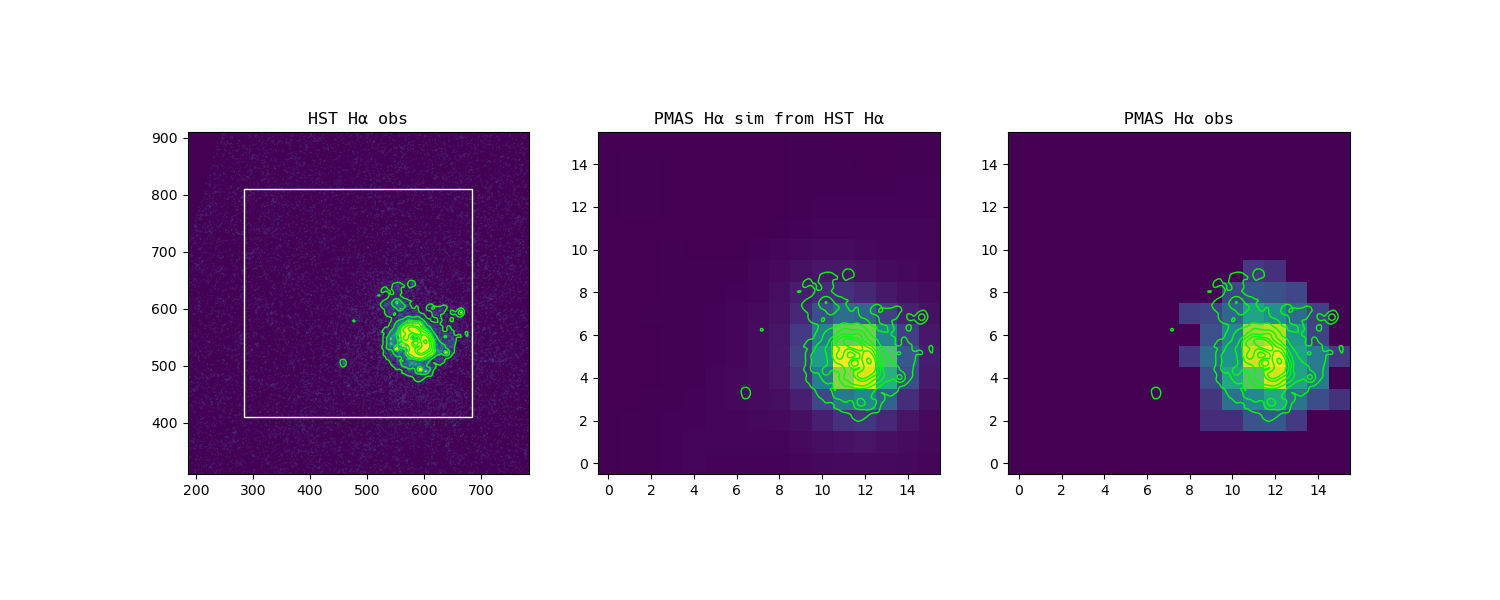
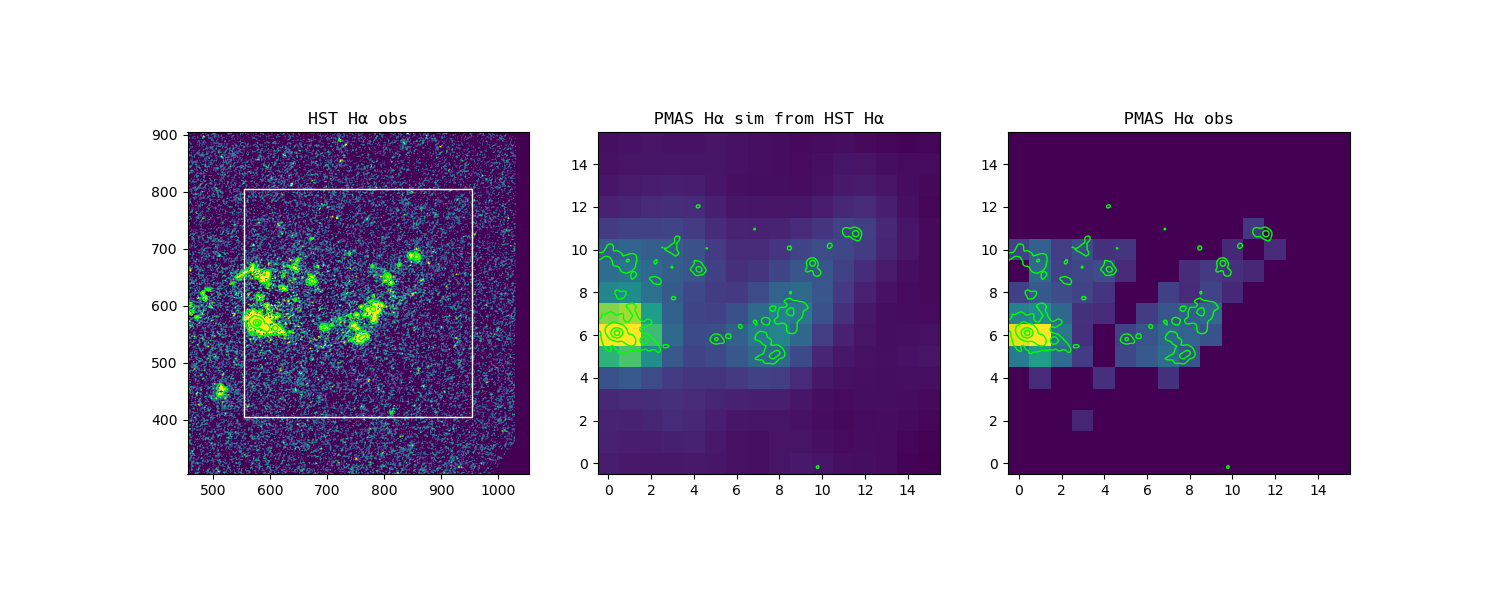
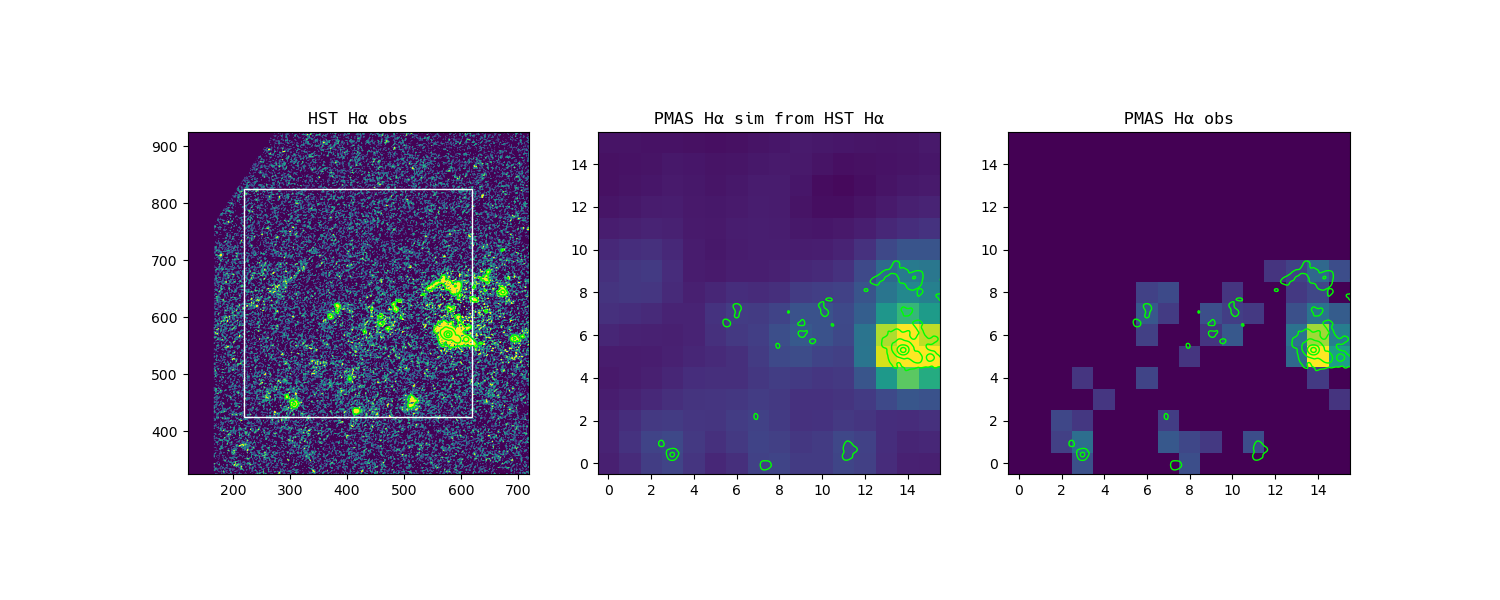
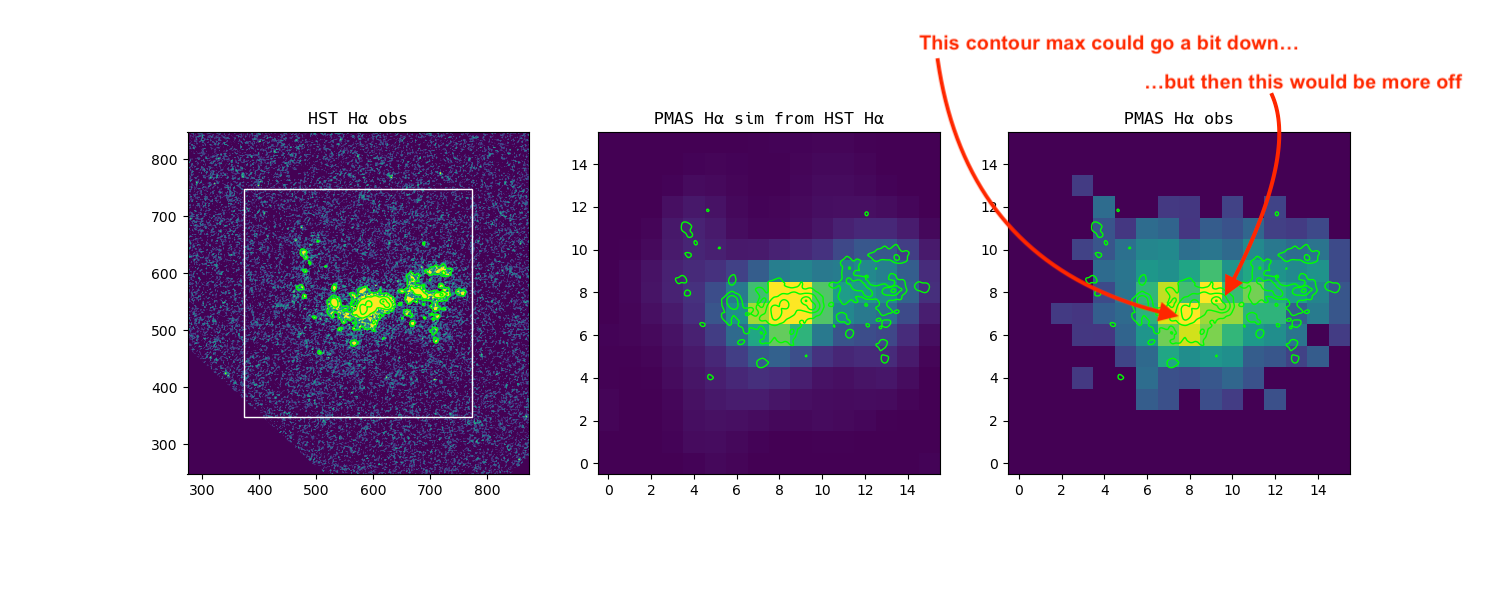
eLARS galaxies gallery showing the alignment of HST Hα images and PMAS IFU observations.
For each image (except the first handful when I didn't think of it), the information needed to reproduce them in ds9 is given below.
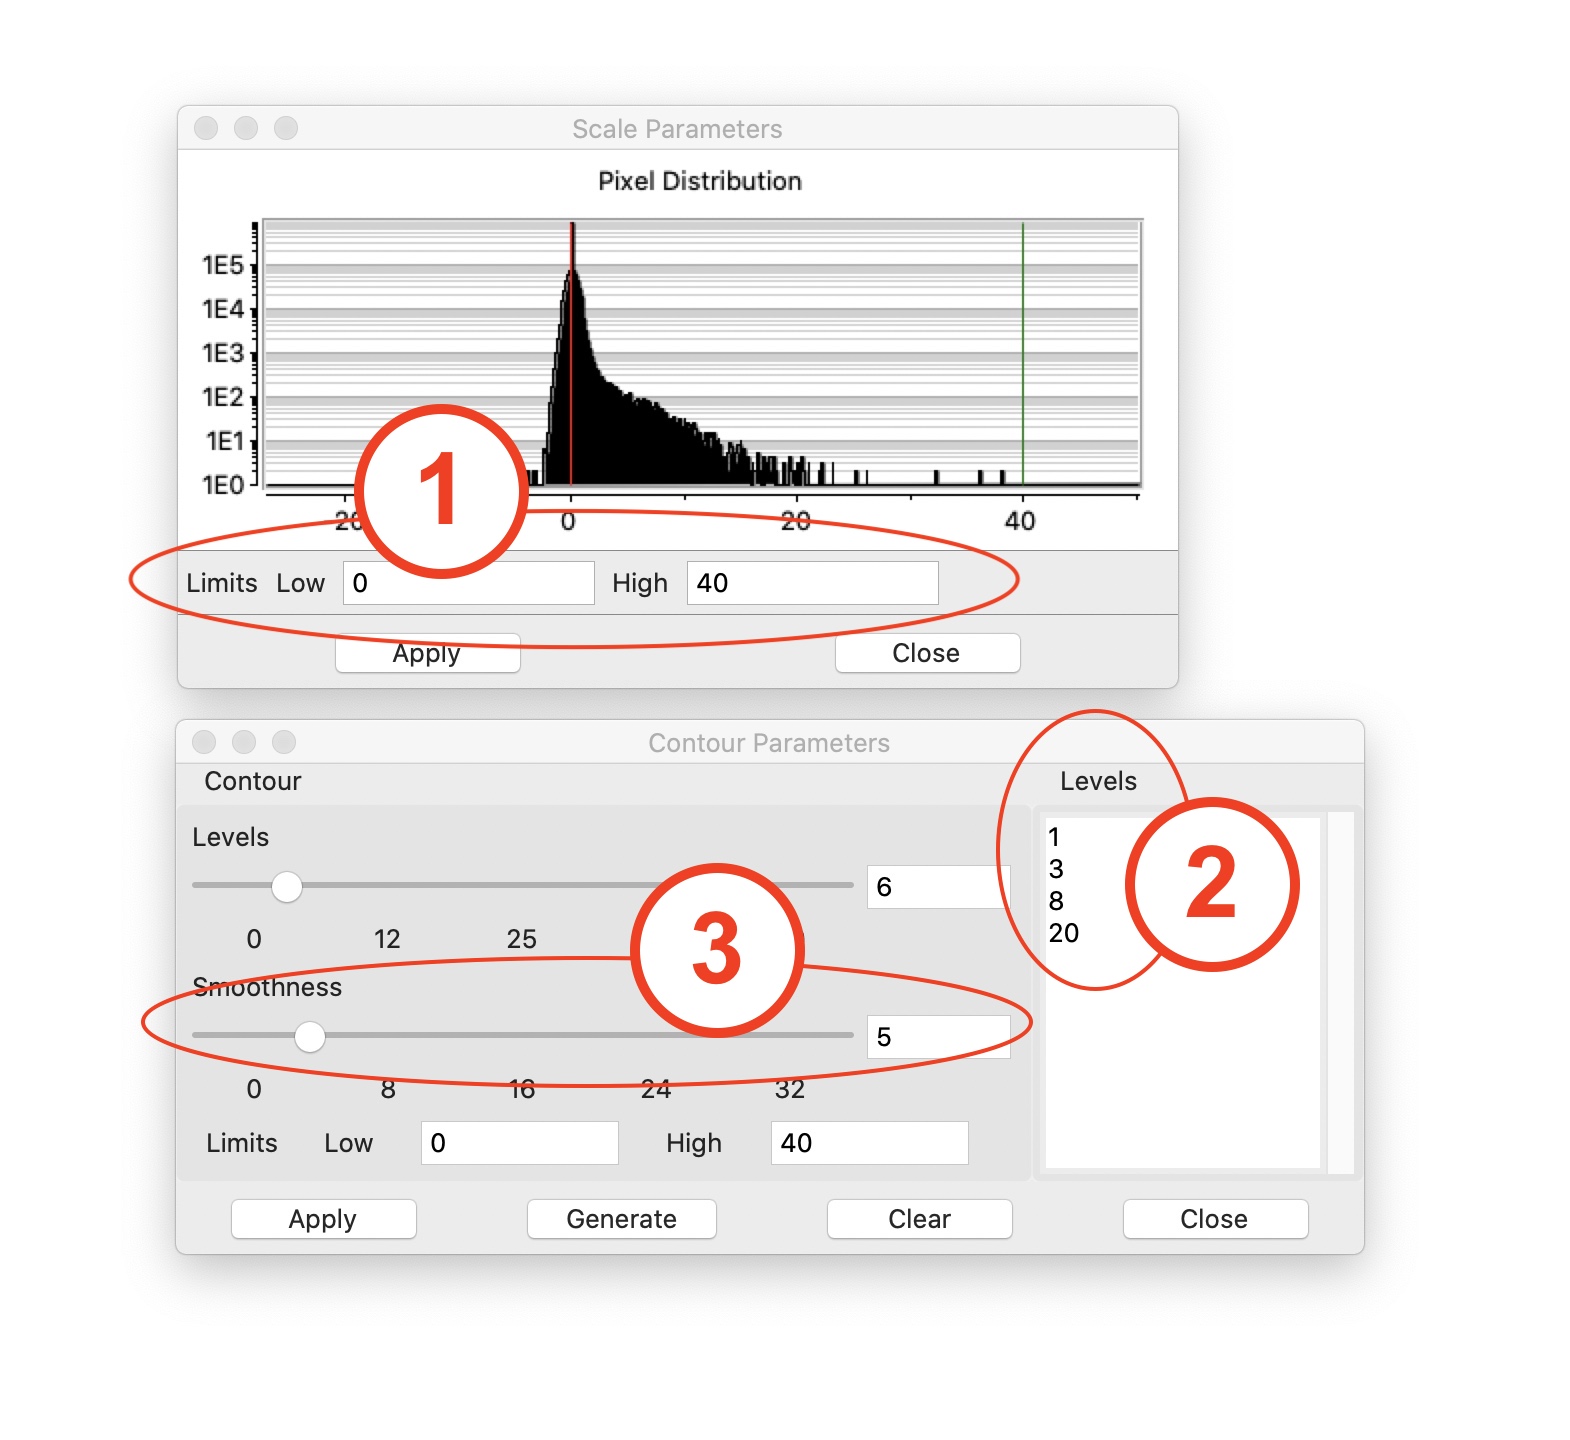
These are the pixel distribution levels min and max values (1 in the figure), contour levels (2), contour smoothness (3),
and arguments given for the where_is_pmas_in_hst.py.
In the gallery, I annotated some comments on why I chose to align them like this. Images with no annotations are perfectly® processed.
Click here to download contour regions, images, and images with annotations:


